柱状图
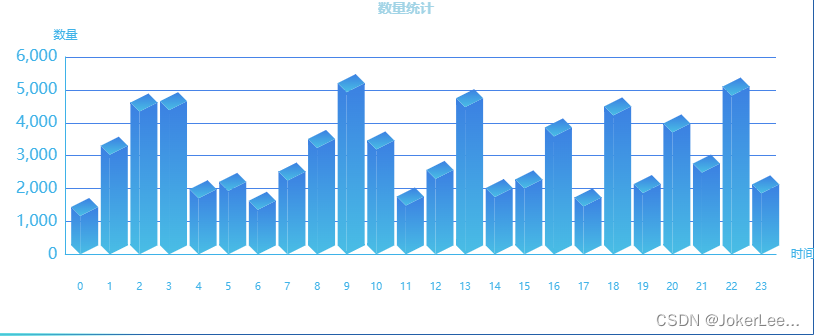
3D柱状图
效果
代码
import { graphic } from 'echarts'

const VALUE = Array.from({ length: 24 }, () => Math.floor(Math.random() * (5000 - 1000)) + 1000)

const CubeLeft = graphic.extendShape({
  shape: {
    x: 0,
    y: 0
  },
  buildPath: function (ctx, shape) {
    const xAxisPoint = shape.xAxisPoint
    const c0 = [shape.x, shape.y]
    const c1 = [shape.x - 9, shape.y - 9]
    const c2 = [xAxisPoint[0] - 9, xAxisPoint[1] - 9]
    const c3 = [xAxisPoint[0], xAxisPoint[1]]
    ctx
      .moveTo(c0[0], c0[1])
      .lineTo(c1[0], c1[1])
      .lineTo(c2[0], c2[1])
      .lineTo(c3[0], c3[1])
      .closePath()
  }
})
const CubeRight = graphic.extendShape({
  shape: {
    x: 0,
    y: 0
  },
  buildPath: function (ctx, shape) {
    const xAxisPoint = shape.xAxisPoint
    const c1 = [shape.x, shape.y]
    const c2 = [xAxisPoint[0], xAxisPoint[1]]
    const c3 = [xAxisPoint[0] + 18, xAxisPoint[1] - 9]
    const c4 = [shape.x + 18, shape.y - 9]
    ctx
      .moveTo(c1[0], c1[1])
      .lineTo(c2[0], c2[1])
      .lineTo(c3[0], c3[1])
      .lineTo(c4[0], c4[1])
      .closePath()
  }
})
const CubeTop = graphic.extendShape({
  shape: {
    x: 0,
    y: 0
  },
  buildPath: function (ctx, shape) {
    const c1 = [shape.x, shape.y]
    const c2 = [shape.x + 18, shape.y - 9]
    const c3 = [shape.x + 9, shape.y - 18]
    const c4 = [shape.x - 9, shape.y - 9]
    ctx
      .moveTo(c1[0], c1[1])
      .lineTo(c2[0], c2[1])
      .lineTo(c3[0], c3[1])
      .lineTo(c4[0], c4[1])
      .closePath()
  }
})
graphic.registerShape('CubeLeft', CubeLeft)
graphic.registerShape('CubeRight', CubeRight)
graphic.registerShape('CubeTop', CubeTop)
const option = {
  backgroundColor: '#010d3a',
  title: {
    left: 'center',
    text: '数量统计',
    textStyle: {
      color: '#A2D4E6',
      fontSize: 14
    }
  },
  grid: {
    left: 20,
    right: 40,
    bottom: '19%',
    containLabel: true
  },
  xAxis: {
    name: '时间',
    type: 'category',
    data: Array.from(new Array(23 + 1).keys()).slice(0),
    axisLine: {
      show: true,
      lineStyle: {
        color: '#3eb2e8'
      }
    },
    offset: 20,
    axisTick: {
      show: false,
      length: 9,
      alignWithLabel: true,
      lineStyle: {
        color: '#7DFFFD'
      }
    },
    axisLabel: {
      fontSize: 10
    }
  },
  yAxis: {
    name: '数量',
    type: 'value',
    axisLine: {
      show: true,
      lineStyle: {
        color: '#3eb2e8'
      }
    },
    splitLine: {
      lineStyle: {
        color: '#4784e8'
      }
    },
    axisTick: {
      show: false
    },
    axisLabel: {
      fontSize: 16
    },
    boundaryGap: ['20%', '20%']
  },
  series: [
    {
      type: 'custom',
      renderItem: (_params, api) => {
        const location = api.coord([api.value(0), api.value(1)])
        return {
          type: 'group',
          children: [
            {
              type: 'CubeLeft',
              shape: {
                api,
                xValue: api.value(0),
                yValue: api.value(1),
                x: location[0],
                y: location[1],
                xAxisPoint: api.coord([api.value(0), 0])
              },
              style: {
                fill: new graphic.LinearGradient(0, 0, 0, 1, [
                  {
                    offset: 0,
                    color: '#3B80E2'
                  },
                  {
                    offset: 1,
                    color: '#49BEE5'
                  }
                ])
              }
            },
            {
              type: 'CubeRight',
              shape: {
                api,
                xValue: api.value(0),
                yValue: api.value(1),
                x: location[0],
                y: location[1],
                xAxisPoint: api.coord([api.value(0), 0])
              },
              style: {
                fill: new graphic.LinearGradient(0, 0, 0, 1, [
                  {
                    offset: 0,
                    color: '#3B80E2'
                  },
                  {
                    offset: 1,
                    color: '#49BEE5'
                  }
                ])
              }
            },
            {
              type: 'CubeTop',
              shape: {
                api,
                xValue: api.value(0),
                yValue: api.value(1),
                x: location[0],
                y: location[1],
                xAxisPoint: api.coord([api.value(0), 0])
              },
              style: {
                fill: new graphic.LinearGradient(0, 0, 0, 1, [
                  {
                    offset: 0,
                    color: '#3B80E2'
                  },
                  {
                    offset: 1,
                    color: '#49BEE5'
                  }
                ])
              }
            }
          ]
        }
      },
      showBackground: true,
      backgroundStyle: {
        color: 'rgba(180, 180, 180, 0.2)'
      },
      data: VALUE
    }
  ]
}
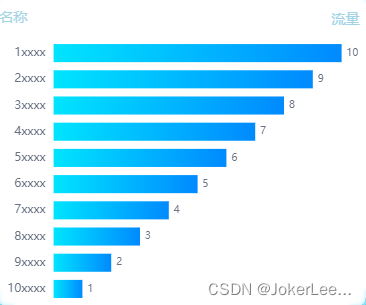
排行榜柱状图
效果
代码
import { graphic } from 'echarts'
const options = {
    tooltip: {
      trigger: 'axis',
      axisPointer: {
        // Use axis to trigger tooltip
        type: 'shadow' // 'shadow' as default; can also be 'line' or 'shadow'
      }
    },
    grid: {
      left: '4%',
      right: '8%',
      bottom: '3%',
      containLabel: true
    },
    xAxis: {
      name: '流量',
      nameLocation: 'end',
      nameTextStyle: {
        color: '#A2D4E6',
        fontSize: 14,
        fontWeight: 400
      },
      offset: 20,
      nameGap: -10,
      position: 'top',
      show: true,
      type: 'value',
      axisLine: {
        show: false
      },
      axisTick: {
        show: false
      },
      axisLabel: {
        show: false
      },
      splitLine: {
        //网格线
        show: false
      }
    },
    yAxis: {
      name: '名称',
      nameTextStyle: {
        color: '#A2D4E6',
        fontSize: 14,
        fontWeight: 400,
        padding: [0, 0, 0, -80]
      },
      type: 'category',
      axisLine: {
        show: false
      },
      axisTick: {
        show: false
      },
      axisLabel: {
        show: true,
        interval: '0',
        textStyle: {
          fontSize: 12,
          color: '#687284'
        }
      },
      data: [
        '10xxxx',
        '9xxxx',
        '8xxxx',
        '7xxxx',
        '6xxxx',
        '5xxxx',
        '4xxxx',
        '3xxxx',
        '2xxxx',
        '1xxxx'
      ]
    },
    series: [
      {
        name: '数量',
        type: 'bar',
        stack: 'total',
        itemStyle: {
          color: new graphic.LinearGradient(0, 0, 1, 0, [
            { offset: 0, color: '#00E4FF' },
            { offset: 1, color: '#008AFF' }
          ])
        },
        emphasis: {
          focus: 'series'
        },
        label: {
          normal: {
            show: true,
            position: 'right',
            color: '#687284',
            fontSize: '10'
          }
        },
        data: [1, 2, 3, 4, 5, 6, 7, 8, 9, 10]
      }
    ]
  }
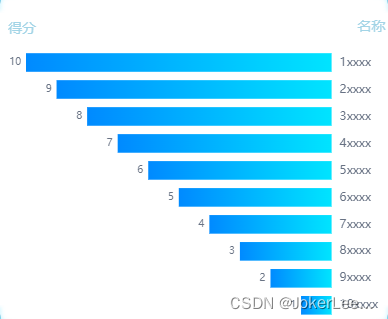
排行榜反转柱状图
效果
代码
import { graphic } from 'echarts'

const options = {
    tooltip: {
      trigger: 'axis',
      axisPointer: {
        // Use axis to trigger tooltip
        type: 'shadow' // 'shadow' as default; can also be 'line' or 'shadow'
      }
    },
    grid: {
      left: '8%',
      right: '4%',
      bottom: '3%',
      containLabel: true
    },
    xAxis: {
      name: '得分',
      nameLocation: 'end',
      nameTextStyle: {
        color: '#A2D4E6',
        fontSize: 14,
        fontWeight: 400
      },
      offset: 20,
      nameGap: -10,
      position: 'top',
      show: true,
      type: 'value',
      axisLine: {
        show: false
      },
      axisTick: {
        show: false
      },
      axisLabel: {
        show: false
      },
      splitLine: {
        //网格线
        show: false
      },
      inverse: true //反转坐标轴
    },
    yAxis: {
      name: '名称',
      nameTextStyle: {
        color: '#A2D4E6',
        fontSize: 14,
        fontWeight: 400,
        padding: [0, 0, 0, 80]
      },
      type: 'category',
      axisLine: {
        show: false
      },
      axisTick: {
        show: false
      },
      axisLabel: {
        show: true,
        interval: '0',
        textStyle: {
          fontSize: 12,
          color: '#687284'
        }
      },
      position: 'right',
      data: [
        '10xxxx',
        '9xxxx',
        '8xxxx',
        '7xxxx',
        '6xxxx',
        '5xxxx',
        '4xxxx',
        '3xxxx',
        '2xxxx',
        '1xxxx'
      ]
    },
    series: [
      {
        name: '数量',
        type: 'bar',
        stack: 'total',
        itemStyle: {
          color: new graphic.LinearGradient(1, 0, 0, 0, [
            { offset: 0, color: '#00E4FF' },
            { offset: 1, color: '#008AFF' }
          ])
        },
        emphasis: {
          focus: 'series'
        },
        label: {
          normal: {
            show: true,
            position: 'left',
            color: '#687284',
            fontSize: '10'
          }
        },
        data: [1, 2, 3, 4, 5, 6, 7, 8, 9, 10]
      }
    ]
  }