机器学习-数据分析模板
Objective
我们的任务:预测一个人的收入能否超过五万美元
人口普查数据集: https://archive.ics.uci.edu/ml/datasets/adult
Data Set Information:
Extraction was done by Barry Becker from the 1994 Census database. A set of reasonably clean records was extracted using the following conditions: ((AAGE>16) && (AGI>100) && (AFNLWGT>1)&& (HRSWK>0))
Prediction task is to determine whether a person makes over 50K a year.
Attribute Information:
Listing of attributes:
50K, <=50K.
age: continuous.
workclass: Private, Self-emp-not-inc, Self-emp-inc, Federal-gov, Local-gov, State-gov, Without-pay, Never-worked.
fnlwgt: continuous.
education: Bachelors, Some-college, 11th, HS-grad, Prof-school, Assoc-acdm, Assoc-voc, 9th, 7th-8th, 12th, Masters, 1st-4th, 10th, Doctorate, 5th-6th, Preschool.
education-num: continuous.
marital-status: Married-civ-spouse, Divorced, Never-married, Separated, Widowed, Married-spouse-absent, Married-AF-spouse.
occupation: Tech-support, Craft-repair, Other-service, Sales, Exec-managerial, Prof-specialty, Handlers-cleaners, Machine-op-inspct, Adm-clerical, Farming-fishing, Transport-moving, Priv-house-serv, Protective-serv, Armed-Forces.
relationship: Wife, Own-child, Husband, Not-in-family, Other-relative, Unmarried.
race: White, Asian-Pac-Islander, Amer-Indian-Eskimo, Other, Black.
sex: Female, Male.
capital-gain: continuous.
capital-loss: continuous.
hours-per-week: continuous.
native-country: United-States, Cambodia, England, Puerto-Rico, Canada, Germany, Outlying-US(Guam-USVI-etc), India, Japan, Greece, South, China, Cuba, Iran, Honduras, Philippines, Italy, Poland, Jamaica, Vietnam, Mexico, Portugal, Ireland, France, Dominican-Republic, Laos, Ecuador, Taiwan, Haiti, Columbia, Hungary, Guatemala, Nicaragua, Scotland, Thailand, Yugoslavia, El-Salvador, Trinadad&Tobago, Peru, Hong, Holand-Netherlands.
INPUT
# Load Training and Test Data Sets
headers = ['age', 'workclass', 'fnlwgt',
           'education', 'education-num',
           'marital-status', 'occupation',
           'relationship', 'race', 'sex',
           'capital-gain', 'capital-loss',
           'hours-per-week', 'native-country',
           'predclass']
training_raw = pd.read_csv('dataset/adult.data',
                       header=None,
                       names=headers,
                       sep=',\s',
                       na_values=["?"],
                       engine='python')
test_raw = pd.read_csv('dataset/adult.test',
                      header=None,
                      names=headers,
                      sep=',\s',
                      na_values=["?"],
                      engine='python',
                      skiprows=1)
header默认是0,即取第零行数据为columns;header=None,即不从数据中取columns
names=headers,即为columns赋值
import pandas as pd
#可以打印说明文档
print (help(pd.read_csv))
# Join Datasets
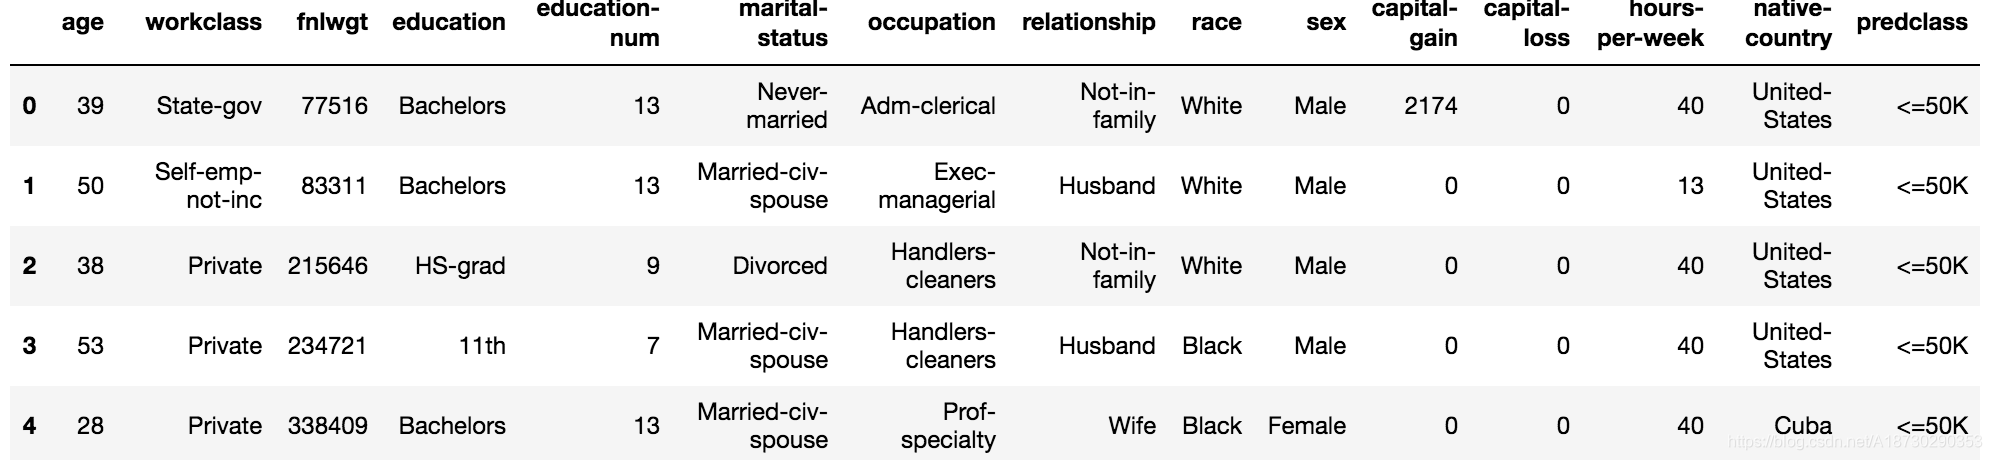
dataset_raw = training_raw.append(test_raw)
dataset_raw.reset_index(inplace=True)
dataset_raw.drop('index',inplace=True,axis=1)
dataset_raw.head()
由于合并数据,导致index乱了,所以reset_index(inplace=True)
属性:
age 年龄 double
workclass 工作类型 string
fnlwgt 序号 string
education 教育程度 string
education_num 受教育时间 double
maritial_status 婚姻状况 string
occupation 职业 string
relationship 关系 string
race 种族 string
sex 性别 string
capital_gain 资本收益 string
capital_loss 资本损失 string
hours_per_week 每周工作小时数 double
native_country 原籍 string
income 收入 string
单特征与缺失值展示
关于特征,我们可以分析单特征,也可以分析不同特征之间的关系,首先来看单特征
特征简单分为两种:类别型和数值型
- Numerical: 都是数
- Categorical: 种类或者字符串
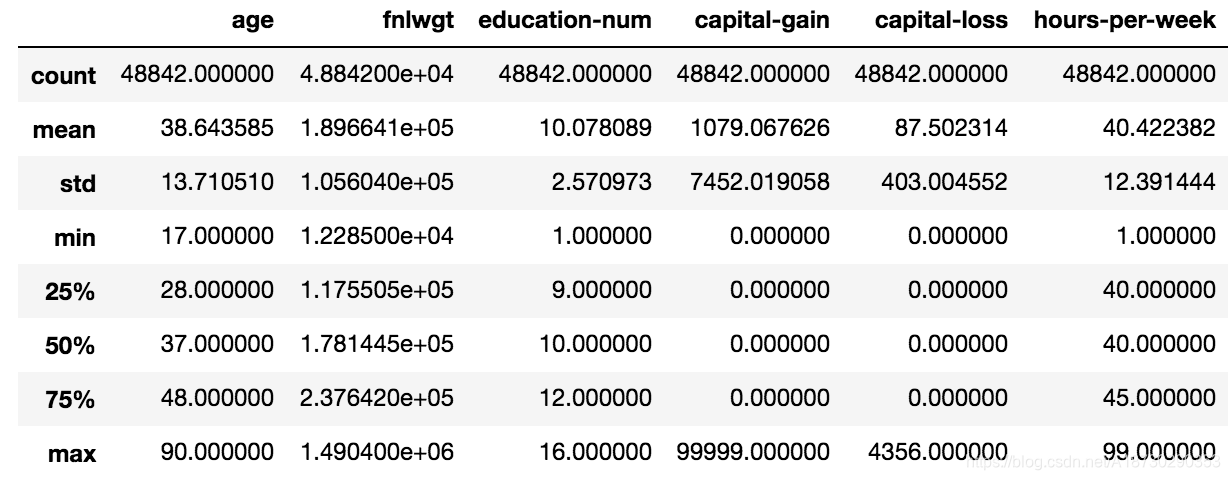
# 会展示所有数值型的特征
dataset_raw.describe()
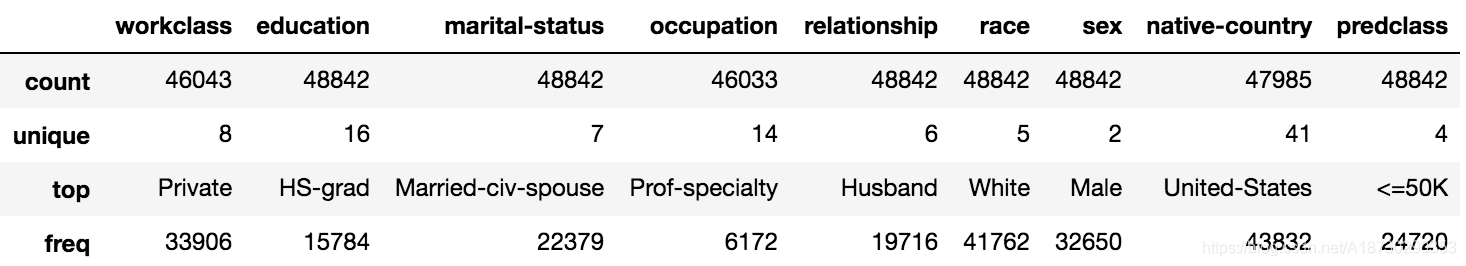
# 展示所有种类型特征,注意是大写的o
dataset_raw.describe(include=['O'])
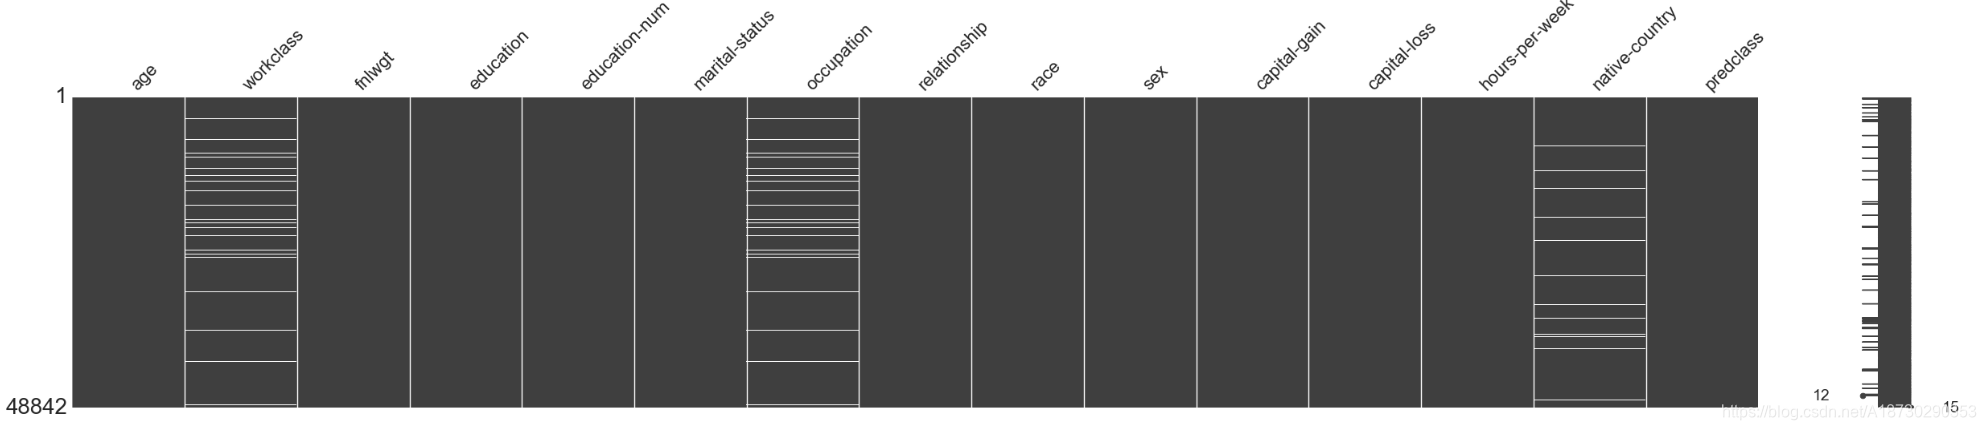
# 缺失值显示
missingno.matrix(dataset_raw, figsize = (30,5))
Feature Cleaning, Engineering
清洗: 数据预处理工作:
- 缺失值: 对缺失值进行填充
- 特殊值: 一些错误导致的特殊值,例如 ±Inf, NA NaN
- 离群点: 这些点可能会对结果产生影响,先把它们找出来
- 错误值: 比如人的年龄不可能出现负数
特征工程: There are multiple techniques for feature engineering:
- 特征分解: 比如将时间数据2014-09-20T20:45:40Z 转换成天,小时等信息.
- 离散化: 我们可以选择离散一些我们所拥有的连续变量,因为一些算法会执行得更快。但是会对结果产生什么样的影响呢?需要比较离散和非离散的建模结果
- dataset_bin => 连续值被离散化的数据集
- dataset_con => 非离散化的数据集
- 特征组合: 将不同的特征组合成一个新特征
缺失值问题: 我们可以填补缺失值,在许多不同的方式::
- 额外的数据补充: 有点难弄
- 均值填充: 这样可以不改变当前数据集整体的均值
- 回归模型预测: 建立一个回归模型去得到预测值
标签转换
如果收入大于 $50K. 那么就是1 反之就是0
# Let's fix the Class Feature
dataset_raw.loc[dataset_raw['predclass'] == '>50K', 'predclass'] = 1
dataset_raw.loc[dataset_raw['predclass'] == '>50K.', 'predclass'] = 1
dataset_raw.loc[dataset_raw['predclass'] == '<=50K', 'predclass'] = 0
dataset_raw.loc[dataset_raw['predclass'] == '<=50K.', 'predclass'] = 0

dataset_bin['predclass'] = dataset_raw['predclass']
dataset_con['predclass'] = dataset_raw['predclass']
#数据不太均衡的
plt.style.use('seaborn-whitegrid')
fig = plt.figure(figsize=(20,1))
sns.countplot(y="predclass", data=dataset_bin);

单变量
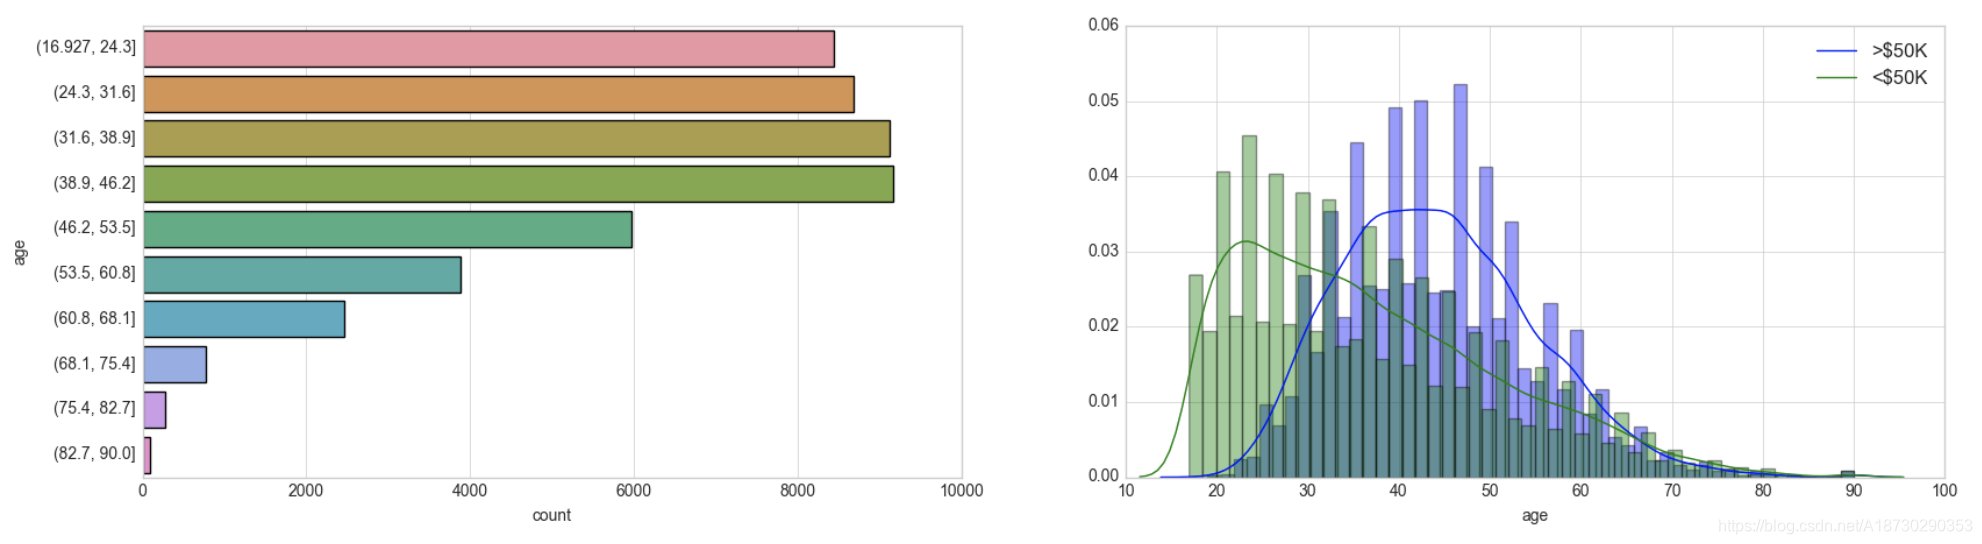
Feature: Age
dataset_bin['age'] = pd.cut(dataset_raw['age'], 10) # 将连续值进行切分
dataset_con['age'] = dataset_raw['age'] # non-discretised
#左图是切分后的结果 右图是根据不同的收入等级划分
plt.style.use('seaborn-whitegrid')
fig = plt.figure(figsize=(20,5))
plt.subplot(1, 2, 1)
sns.countplot(y="age", data=dataset_bin);
plt.subplot(1, 2, 2)
sns.distplot(dataset_con.loc[dataset_con['predclass'] == 1]['age'], kde_kws={"label": ">$50K"});
sns.distplot(dataset_con.loc[dataset_con['predclass'] == 0]['age'], kde_kws={"label": "<$50K"});
Feature: Workclas
# 工作的种类
plt.style.use('seaborn-whitegrid')
plt.figure(figsize=(20,3))
sns.countplot(y="workclass", data=dataset_raw);
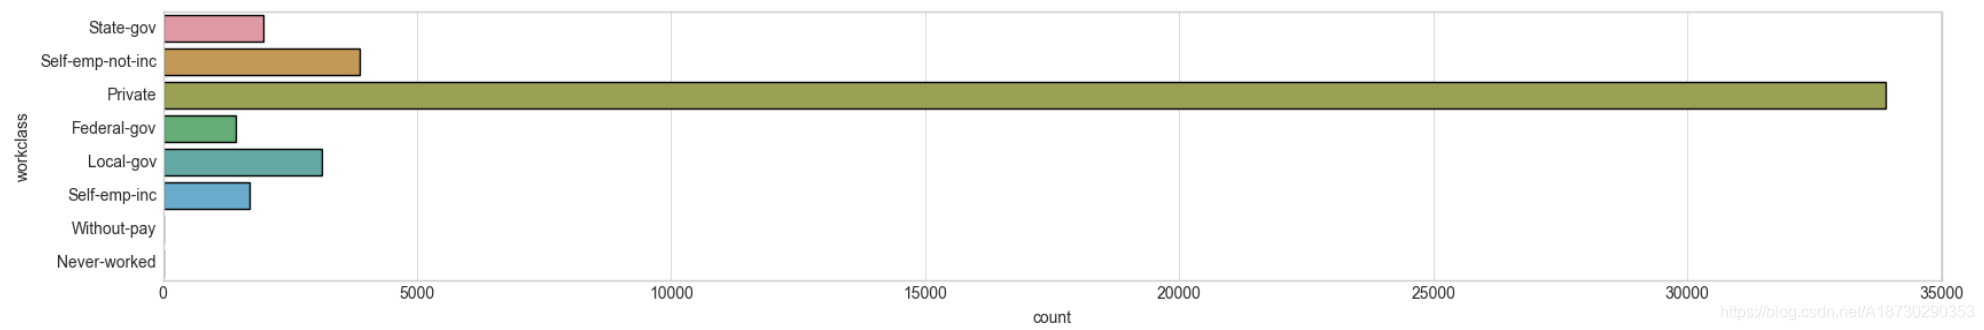
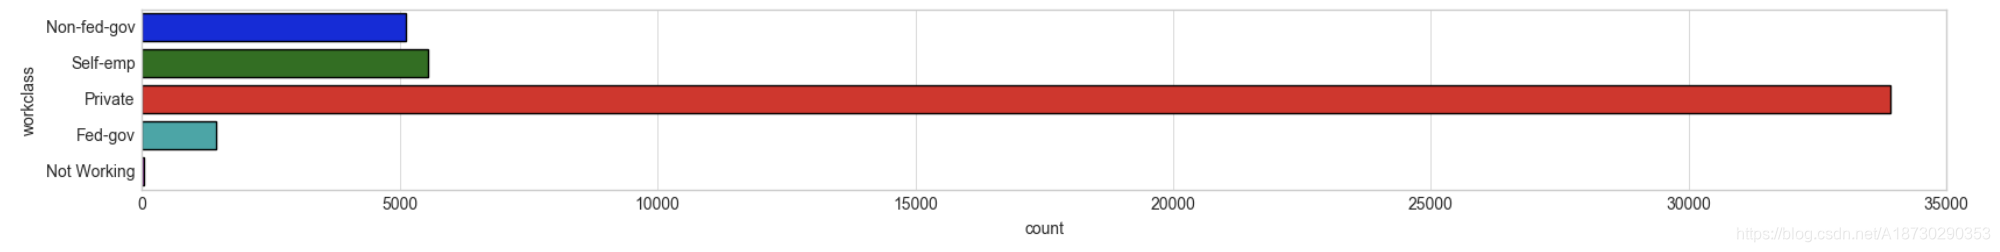
# 种类有些太多了,有些类似的要进行合并
dataset_raw.loc[dataset_raw['workclass'] == 'Without-pay', 'workclass'] = 'Not Working'
dataset_raw.loc[dataset_raw['workclass'] == 'Never-worked', 'workclass'] = 'Not Working'
dataset_raw.loc[dataset_raw['workclass'] == 'Federal-gov', 'workclass'] = 'Fed-gov'
dataset_raw.loc[dataset_raw['workclass'] == 'State-gov', 'workclass'] = 'Non-fed-gov'
dataset_raw.loc[dataset_raw['workclass'] == 'Local-gov', 'workclass'] = 'Non-fed-gov'
dataset_raw.loc[dataset_raw['workclass'] == 'Self-emp-not-inc', 'workclass'] = 'Self-emp'
dataset_raw.loc[dataset_raw['workclass'] == 'Self-emp-inc', 'workclass'] = 'Self-emp'

dataset_bin['workclass'] = dataset_raw['workclass']
dataset_con['workclass'] = dataset_raw['workclass']
plt.style.use('seaborn-whitegrid')
fig = plt.figure(figsize=(20,2))
sns.countplot(y="workclass", data=dataset_bin);
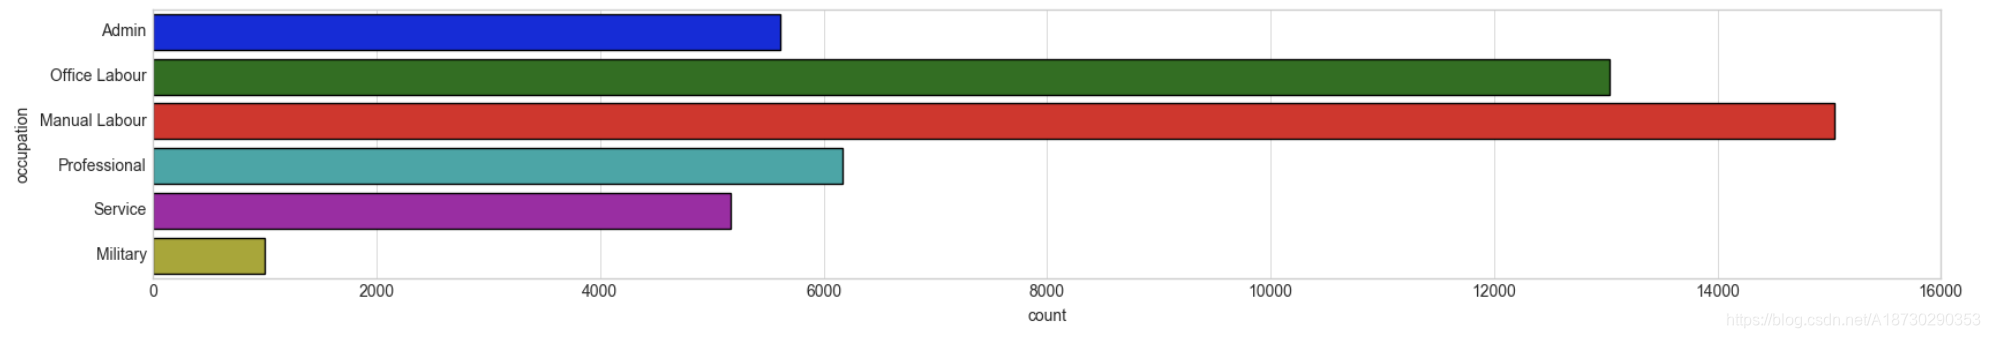
Feature: Occupation职业
# 职业也是同样的问题,重复的太多了
plt.style.use('seaborn-whitegrid')
plt.figure(figsize=(20,5))
sns.countplot(y="occupation", data=dataset_raw);
# Create buckets for Occupation
dataset_raw.loc[dataset_raw['occupation'] == 'Adm-clerical', 'occupation'] = 'Admin'
dataset_raw.loc[dataset_raw['occupation'] == 'Armed-Forces', 'occupation'] = 'Military'
dataset_raw.loc[dataset_raw['occupation'] == 'Craft-repair', 'occupation'] = 'Manual Labour'
dataset_raw.loc[dataset_raw['occupation'] == 'Exec-managerial', 'occupation'] = 'Office Labour'
dataset_raw.loc[dataset_raw['occupation'] == 'Farming-fishing', 'occupation'] = 'Manual Labour'
dataset_raw.loc[dataset_raw['occupation'] == 'Handlers-cleaners', 'occupation'] = 'Manual Labour'
dataset_raw.loc[dataset_raw['occupation'] == 'Machine-op-inspct', 'occupation'] = 'Manual Labour'
dataset_raw.loc[dataset_raw['occupation'] == 'Other-service', 'occupation'] = 'Service'
dataset_raw.loc[dataset_raw['occupation'] == 'Priv-house-serv', 'occupation'] = 'Service'
dataset_raw.loc[dataset_raw['occupation'] == 'Prof-specialty', 'occupation'] = 'Professional'
dataset_raw.loc[dataset_raw['occupation'] == 'Protective-serv', 'occupation'] = 'Military'
dataset_raw.loc[dataset_raw['occupation'] == 'Sales', 'occupation'] = 'Office Labour'
dataset_raw.loc[dataset_raw['occupation'] == 'Tech-support', 'occupation'] = 'Office Labour'
dataset_raw.loc[dataset_raw['occupation'] == 'Transport-moving', 'occupation'] = 'Manual Labour'

dataset_bin['occupation'] = dataset_raw['occupation']
dataset_con['occupation'] = dataset_raw['occupation']
plt.style.use('seaborn-whitegrid')
fig = plt.figure(figsize=(20,3))
sns.countplot(y="occupation", data=dataset_bin);
Feature: Native Country
# 同样进行合并
plt.style.use('seaborn-whitegrid')
plt.figure(figsize=(20,10))
sns.countplot(y="native-country", data=dataset_raw);
Feature: Education
# 教育也进行合并
plt.style.use('seaborn-whitegrid')
plt.figure(figsize=(20,5))
sns.countplot(y="education", data=dataset_raw);
Feature: Marital Status
Feature: Final Weight
# 同样分成10份
dataset_bin['fnlwgt'] = pd.cut(dataset_raw['fnlwgt'], 10)
dataset_con['fnlwgt'] = dataset_raw['fnlwgt']
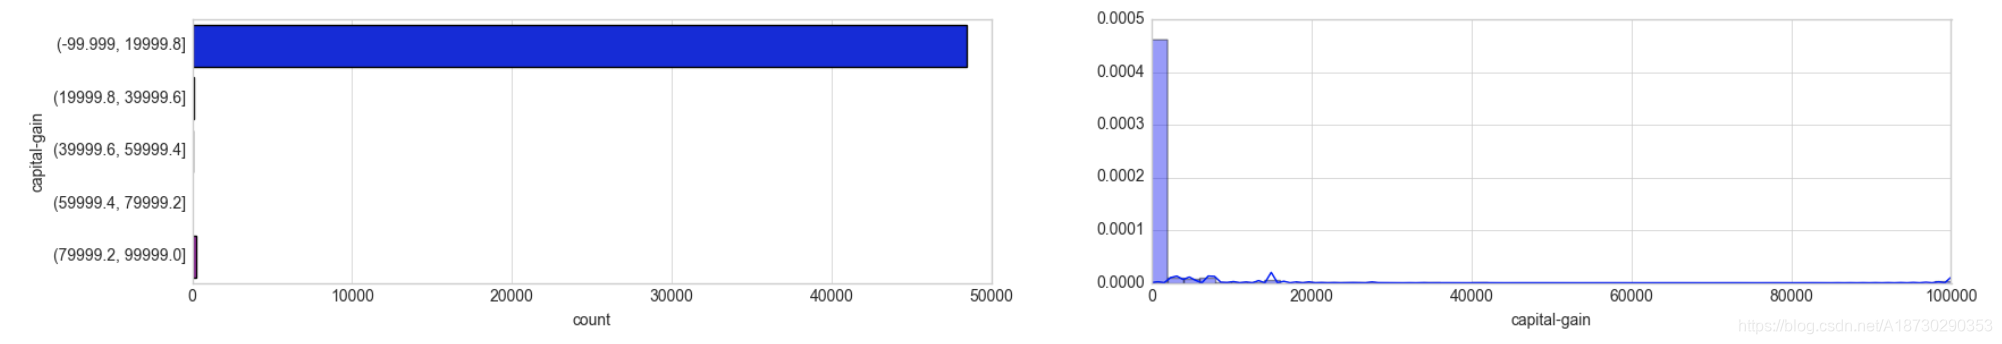
Feature: Capital Gain
#资本增益
dataset_bin['capital-gain'] = pd.cut(dataset_raw['capital-gain'], 5)
dataset_con['capital-gain'] = dataset_raw['capital-gain']

plt.style.use('seaborn-whitegrid')
fig = plt.figure(figsize=(20,3))
plt.subplot(1, 2, 1)
sns.countplot(y="capital-gain", data=dataset_bin);
plt.subplot(1, 2, 2)
sns.distplot(dataset_con['capital-gain']);
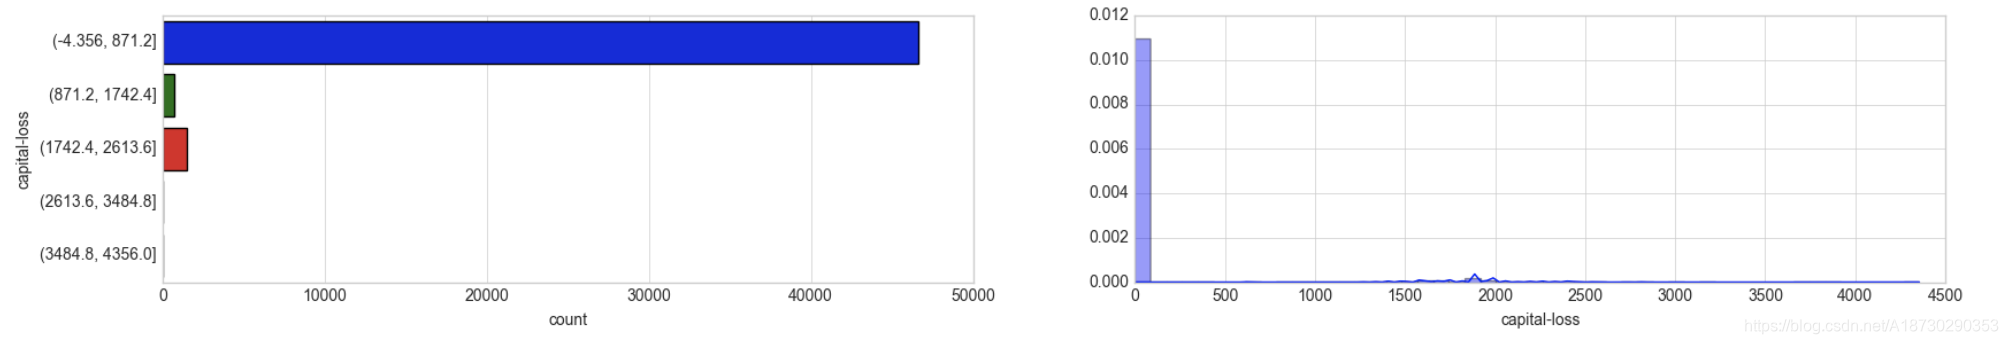
Feature: Capital Loss
# 资本损失
dataset_bin['capital-loss'] = pd.cut(dataset_raw['capital-loss'], 5)
dataset_con['capital-loss'] = dataset_raw['capital-loss']

plt.style.use('seaborn-whitegrid')
fig = plt.figure(figsize=(20,3))
plt.subplot(1, 2, 1)
sns.countplot(y="capital-loss", data=dataset_bin);
plt.subplot(1, 2, 2)
sns.distplot(dataset_con['capital-loss']);
Features: Race, Sex, Relationship
# 这些就直接用了
dataset_con['sex'] = dataset_bin['sex'] = dataset_raw['sex']
dataset_con['race'] = dataset_bin['race'] = dataset_raw['race']
dataset_con['relationship'] = dataset_bin['relationship'] = dataset_raw['relationship']`
双变量
接下来要看特征之间的关系了
特征编码 Feature Encoding
对特征进行编码,因为机器学习只认识数字
常见编码方式Additional Resources: http://pbpython.com/categorical-encoding.html
两种常见的编码方式:
- one hot encoding
- label encoding (如果有10种可能,就编码为0-9)
两种数据集:
- dataset_bin => 连续值被离散化的数据集
- dataset_con => 非离散化的数据集
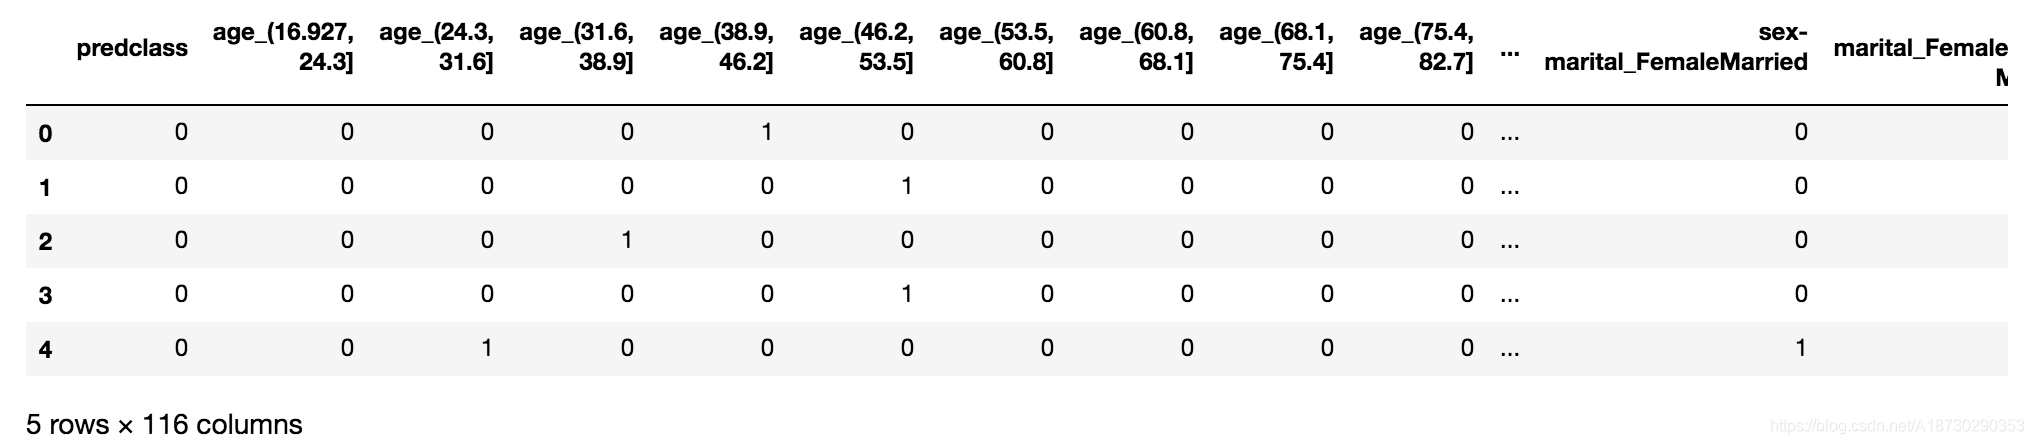
One Hot Encodes
# One Hot Encodes
one_hot_cols = dataset_bin.columns.tolist()
one_hot_cols.remove('predclass')
dataset_bin_enc = pd.get_dummies(dataset_bin, columns=one_hot_cols)

dataset_bin_enc.head()
pd.get_dummie就能得到one hot编码
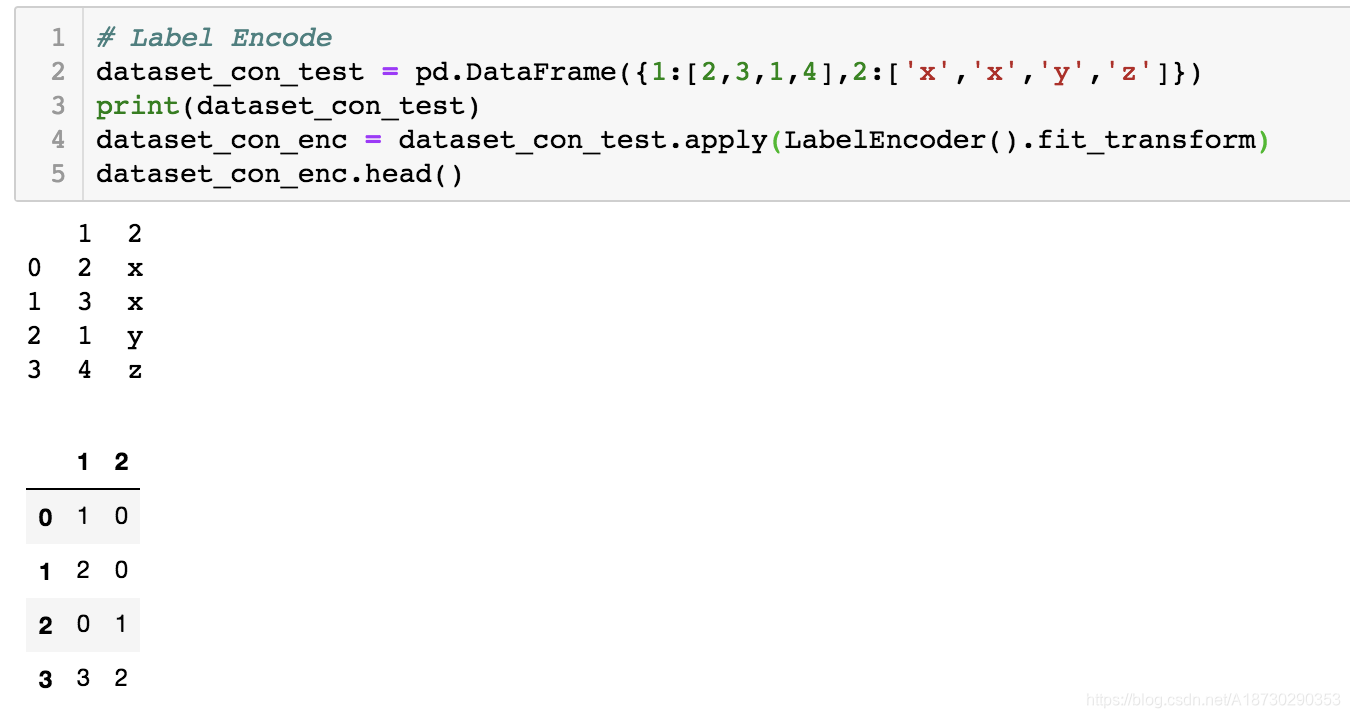
Label Encode
# Label Encode
dataset_con_test = dataset_con
dataset_con_test['workclass'] = dataset_con['workclass'].factorize()[0]
dataset_con_test['occupation'] = dataset_con['occupation'].factorize()[0]
dataset_con_test['native-country'] = dataset_con['native-country'].factorize()[0]
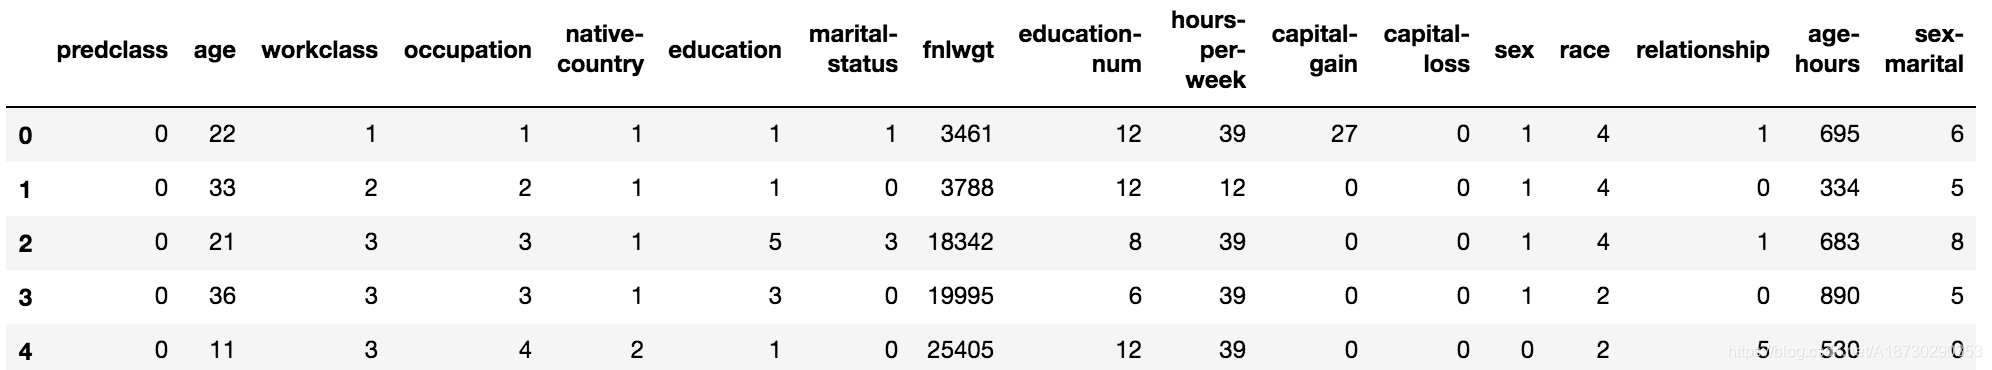
dataset_con_enc = dataset_con_test.apply(LabelEncoder().fit_transform)
dataset_con_enc.head()
如果注视掉中间三个语句dataset_con_test[‘workclass’] 、dataset_con_test[‘occupation’] 、dataset_con_test[‘native-country’] ,就会报错
TypeError: ("’<’ not supported between instances of ‘str’ and ‘float’", ‘occurred at index workclass’)
原因是这三个属性中有nan值,所以报错
# Label Encode
dataset_con_test = dataset_con

# dataset_con_test['workclass'] = dataset_con['workclass'].factorize()[0]
# dataset_con_test['occupation'] = dataset_con['occupation'].factorize()[0]
# dataset_con_test['native-country'] = dataset_con['native-country'].factorize()[0]

dataset_con_enc = dataset_con_test.apply(LabelEncoder().fit_transform)

dataset_con_enc.head()
参考factorize()用法,该函数使作用于series ,factorize()[0]作用类似于label encode,会将nan转为-1(LabelEncoder不能处理空值),如下图
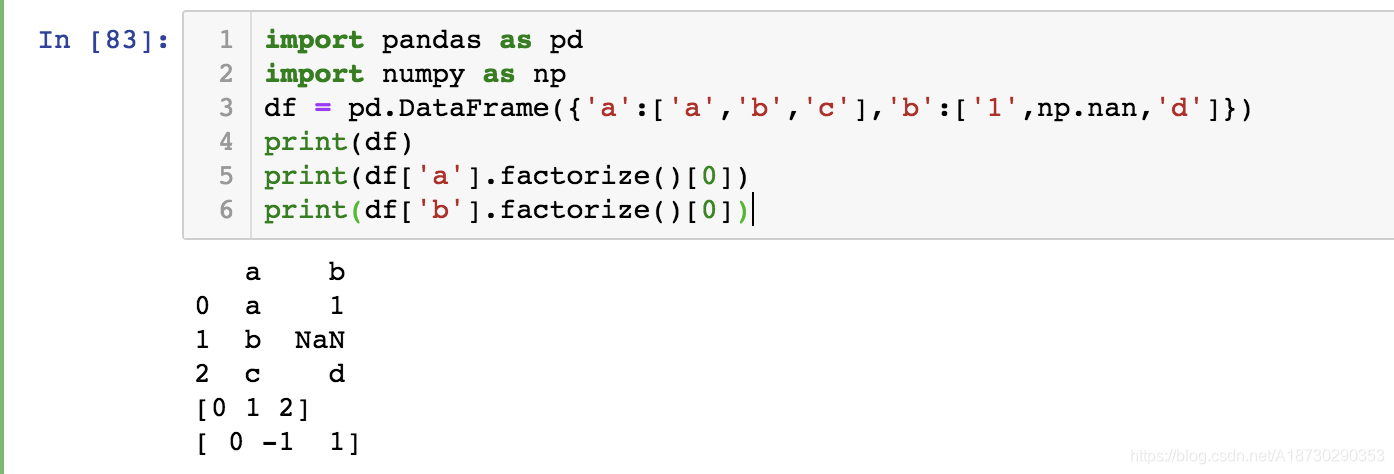
label encoding 例子