组织结构图一般是树图结构。echars是一个很好的开源数据工具,2.x版本也有对树图的定义;
要做组织结构图的需求拿到手里后,在网上也翻阅了很多echarts的官网资料及网友的实现思路。最终在网友及自身的努力下完成了这项任务。
以上!
先上最终结果图:
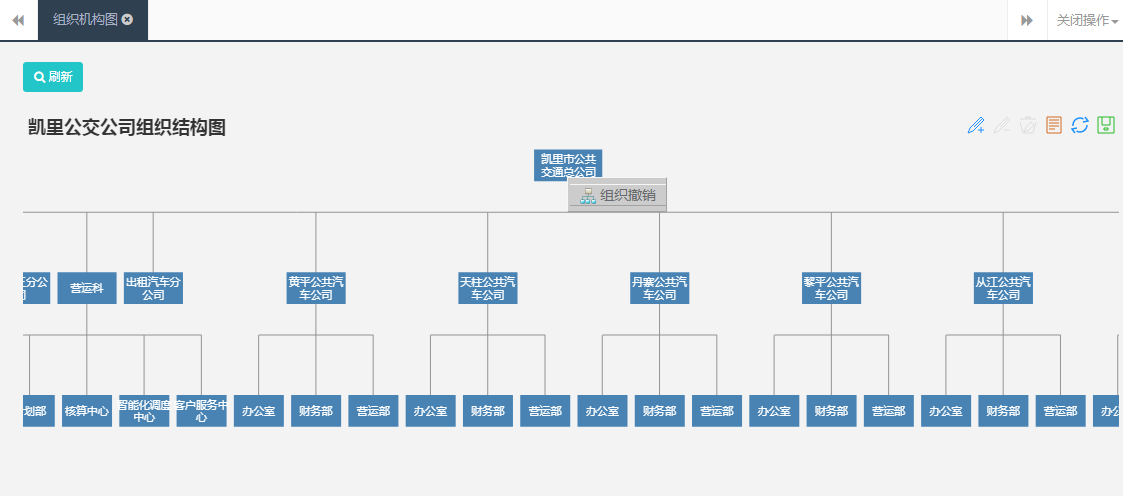
由于部门较多,图表加了滚动缩放及拖动。
具体实现:
1.了解echarts树图的数据结构。
data: [
                {
                    name: '手机',
                    value: 6,
                    symbolSize: [90, 70],
                    symbol: 'image://http://www.iconpng.com/png/ecommerce-business/iphone.png',
                    itemStyle: {
                        normal: {
                            label: {
                                show: false
                            }
                        }
                    },
                    children: [
                        {
                            name: '小米',
                            value: 4,
                            symbol: 'image://http://pic.58pic.com/58pic/12/36/51/66d58PICMUV.jpg',
                            itemStyle: {
                                normal: {
                                    label: {
                                        show: false
                                    }
                                }
                            },
                            symbolSize: [60, 60],
                            children: [
                                {
                                    name: '小米1',
                                    symbol: 'circle',
                                    symbolSize: 20,
                                    value: 4,
                                    itemStyle: {
                                        normal: {
                                            color: '#fa6900',
                                            label: {
                                                show: true,
                                                position: 'right'
                                            },

                                        },
                                        emphasis: {
                                            label: {
                                                show: false
                                            },
                                            borderWidth: 0
                                        }
                                    }
                                },
                                {
                                    name: '小米2',
                                    value: 4,
                                    symbol: 'circle',
                                    symbolSize: 20,
                                    itemStyle: {
                                        normal: {
                                            label: {
                                                show: true,
                                                position: 'right',
                                                formatter: "{b}"
                                            },
                                            color: '#fa6900',
                                            borderWidth: 2,
                                            borderColor: '#cc66ff'

                                        },
                                        emphasis: {
                                            borderWidth: 0
                                        }
                                    }
                                },
                                {
                                    name: '小米3',
                                    value: 2,
                                    symbol: 'circle',
                                    symbolSize: 20,
                                    itemStyle: {
                                        normal: {
                                            label: {
                                                position: 'right'
                                            },
                                            color: '#fa6900',
                                            brushType: 'stroke',
                                            borderWidth: 1,
                                            borderColor: '#999966',
                                        },
                                        emphasis: {
                                            borderWidth: 0
                                        }
                                    }
                                }
                            ]
                        },
                        {
                            name: '苹果',
                            symbol: 'image://http://www.viastreaming.com/images/apple_logo2.png',
                            symbolSize: [60, 60],
                            itemStyle: {
                                normal: {
                                    label: {
                                        show: false
                                    }

                                }
                            },
                            value: 4
                        },
                        {
                            name: '华为',
                            symbol: 'image://http://market.huawei.com/hwgg/logo_cn/download/logo.jpg',
                            symbolSize: [60, 60],
                            itemStyle: {
                                normal: {
                                    label: {
                                        show: false
                                    }

                                }
                            },
                            value: 2
                        },
                        {
                            name: '联想',
                            symbol: 'image://http://www.lenovo.com.cn/HomeUpload/Home001/6d94ee9a20140714.jpg',
                            symbolSize: [100, 40],
                            itemStyle: {
                                normal: {
                                    label: {
                                        show: false
                                    }

                                }
                            },
                            value: 2
                        }
                    ]
所有,可以理解为:
var zNodes=[{id:1,pId:0,name:"董事长"},
		{id:11,pId:1,name:"经理"},
		{id:12,pId:1,name:"副总"},
		{id:13,pId:1,name:"秘书"},
		{id:16,pId:11,name:"财务经理"},
		{id:27,pId:11,name:"人事经理"},
		{id:18,pId:12,name:"HR"},];
子节点的父节点id对应可以找到其父节点。
2.对数据的组装解析成echarts所需要的数据类型:
(这里修改了网友的方法)
function treeMenu(a) {
	// 列表map形式
	this.tree = a || [];
	this.groups = {};
	// 存放id与对应的name映射
	this.nameMap = {};
	// 得到每个点对应的层次,为了后期进行布局
	this.levelMap = {};
	// 样式设计
	this.style = {
		'symbolSize' : [ 75, 65, 55, 45, 35 ]
	/*,'value' : [ 8, 6, 4, 2, 1 ]*/
	};

	// 存放id与对应的status映射
	this.statusMap = {};
	// 存放id与对应的code映射
	this.codeMap = {};
};
treeMenu.prototype = {
	init : function(pid) {
		this.group();
		this.MapNamebyId();//id-name key对
		this.MapStatusbyId();//id-status key对
		this.MapCodebyId();//id-code key对
		this.setIdLevel(pid);
		return this.rescusive(pid);
	},
	group : function() {
		for ( var i = 0; i < this.tree.length; i++) {
			// 存在该grops则直接添加
			if (this.groups[this.tree[i].pId]) {
				this.groups[this.tree[i].pId].push(this.tree[i]);
			} else {
				this.groups[this.tree[i].pId] = [];
				this.groups[this.tree[i].pId].push(this.tree[i]);
			}
		}
	},
	// 得到每个点的层次
	setIdLevel : function(pid) {
		debugger;
		var level = 1;
		this.levelMap[pid] = level;
		var gs = this.groups[pid];
		// str=JSON.stringify(gs)
		// alert("json:"+str)
		var temp = [];
		while (gs) {
			level++;
			if (gs == null || gs == undefined || gs.length == 0)
				break;
			temp = [];
			for ( var i = 0; i < gs.length; i++) {
				var myid = gs[i]['id'];
				this.levelMap[myid] = level;
				subgs = this.groups[myid];
				if (subgs instanceof Array && subgs != null) {
					for ( var j = 0; j < subgs.length; j++) {
						temp.push(subgs[j]);
					}
				}
			}
			gs = temp;
		}

	},
	// 根据所在层次设计不同大小的样式
	getStyleById : function(id) {
		var level = this.levelMap[id];
		if (level >= 5)
			level = 5;
		var symbolize = 0;
		//var value = 0;
		symbolize = this.style['symbolSize'][level - 1];
		//value = this.style['value'][level - 1];
		var styleValue = {};
		styleValue['symbolSize'] = symbolize;
		//styleValue['value'] = value;
		return styleValue;
	},
	MapNamebyId : function() {//id对应的组织名
		for ( var i = 0; i < this.tree.length; i++) {
			map = this.tree[i];
			this.nameMap[map["id"]] = map["name"];
		}
	},
	MapStatusbyId : function() {//id对应的组织状态status
		for ( var i = 0; i < this.tree.length; i++) {
			map = this.tree[i];
			this.statusMap[map["id"]] = map["status"];
		}
	},
	MapCodebyId : function() {//id对应的组织名
		debugger;
		for ( var i = 0; i < this.tree.length; i++) {
			map = this.tree[i];
			this.codeMap[map["id"]] = map["code"];
		}
	},
	MapNamebyId : function() {//id对应的组织名
		for ( var i = 0; i < this.tree.length; i++) {
			map = this.tree[i];
			this.nameMap[map["id"]] = map["name"];
		}
	},
	// 设置节点属性
	setNode : function(node, name, symbolize, value, children,nodeStatus) {
		var font_bkcolor='#4883b4';
		if(nodeStatus!="1"){
			font_bkcolor="red";
		}
		if((name)&&name.length>4){
			var str = '';
			var strs = name.split(''); //字符串数组

			for(var i = 0, s; s = strs[i++];) { //遍历字符串数组
			str += s;
			if(!(i % 5)) str += '\n'; //按需要求余
			}
			if(str.substring(str.length-1,str.length)=='\n'){
				name=str.substring(0,str.length-1);
			}else{
				name=str;
			}
			//name=str.substring(0,str.length-1);
		}
		node['name'] = name;
		node['symbolSize'] = [symbolize,35];//宽,高
		node['value'] = value;
		node['nodeStatus'] = nodeStatus;
		node['children'] = children;
		node['symbol'] = 'rectangle';
		node['itemStyle'] ={normal: {label: {
					            show: true,
					            position: 'inside',
					            	textStyle: {
		                                color: '#FFFFFF'
		                            }
					        },
					        color: font_bkcolor/*,
					        borderWidth: 1,
					        borderColor: '#4883b4'*/
					        	}
							};
		return node;
	},
	rescusive : function(number) {
		var data = [];
		var node = {};
		var styleValue = {};
		// 某个节点下的子节点
		var a = this.groups[number];
		var nodeName = this.nameMap[number];
		var nodeStatus = this.statusMap[number];
		var nodeCode = this.codeMap[number];
		if (a == null || a == undefined) {
			styleValue = this.getStyleById(number);
			// 设置节点
			this.setNode(node, nodeName, styleValue['symbolSize'],
					nodeCode/*styleValue['value']*/, [],nodeStatus);
			return node;
		}
		for ( var i = 0; i < a.length; i++) {
			children = this.rescusive(a[i].id);
			data.push(children);
		}
		styleValue = this.getStyleById(number);
		this.setNode(node, nodeName, styleValue['symbolSize'],
				nodeCode/*styleValue['value']*/, data,nodeStatus);
		return node;
	},
	// 创建组织结构图
	createTreeVisual : function(myChart, title, data) {
		option = {
			    title : {
			        text: title
			    },
			    toolbox: {
			        show : true,
			        feature : {
			            mark : {show: true},
			            dataView : {show: true, readOnly: false},
			            restore : {show: true},
			            saveAsImage : {show: true}
			        }
			    },
			    tooltip: {
			    	show : false,
			        trigger: 'item',
			        triggerOn: 'mousemove',
			        formatter : '{b}: {c}'
			    },
			    series : [
			        {
			            name:'树图',
			            type:'tree',
			            orient: 'vertical',  // vertical horizontal
			            rootLocation: {x: 'center',y: 50}, // 根节点位置  {x: 100, y: 'center'}
			            nodePadding: 8,
			            layerPadding: 100,
			            hoverable: false,
			            roam: true,
			            symbolSize: 6,
			            itemStyle: {
			                normal: {
			                    color: '#4883b4',
			                    label: {
			                        show: true,
			                        position: 'right',
			                        formatter: "{b}",
			                        textStyle: {
			                            color: '#000',
			                            fontSize: 10
			                        }
			                    },
			                    lineStyle: {
			                        color: '#8A8A8A',//关系线的颜色
			                        type: 'broken' // 'curve'|'broken'|'solid'|'dotted'|'dashed'

			                    }
			                },
			                emphasis: {
			                    //color: '#4883b4',
			                    label: {
			                        show: false
			                    },
			                    borderWidth: 0
			                }
			            },

			            data: data
			        }
			    ]
			};

		myChart.setOption(option);
	}
}
// 得到数据测试用
function getData(zNodes) {
	var mytree = new treeMenu(zNodes);
	var treeData = mytree.init(0);
	var data = [];
	data.push(treeData);
	return data;
	// str=JSON.stringify(menu);
	// alert("responsing json:"+str)
}
function createTreeV(myChart, title, znodes) {
	var mytree = new treeMenu(znodes);
	var treeData = mytree.init(62);//注意:是第一级节点id号
	var data = [];
	data.push(treeData);
	mytree.createTreeVisual(myChart, title, data);
}
// getData()
3.用过后台查询数据返回到前台,并创建树图
//初始化echarts
var myEchart = echarts.init(document.getElementById('echartDepId'));
/****
			显示数据
			***/
			me.viewData = function(rowSet){
				zNodes=[];
				debugger;
				for(var i=0,count = rowSet.getRowCount();i<count;i++){
					var row = rowSet.getRow(i);
					var jsonStr = "{";// json格式开始
					jsonStr += '"id":' + '"' + row.getItemValue("deptId") + '",'+
					'"pId":' + '"' + row.getItemValue("upperDeptId") + '",'+
					'"name":' + '"' + row.getItemValue("deptName") + '",'+
					'"status":' + '"' + row.getItemValue("status") + '",'+
					'"code":' + '"' + row.getItemValue("deptCode") + '",';
					jsonStr = jsonStr.replace(/,{1}$/gi, '');// 删除最后的逗号
					jsonStr += "}";// //json格式结束

                     			var jsonObj = jQuery.parseJSON(jsonStr);//将每条数据逐个转换成json对象,并push到itemJsonArray中
                    				zNodes.push(jsonObj);
				}
				//alert("zNodes2222:"+JSON.stringify(zNodes));
				createTreeV(myEchart,"凯里公交公司组织结构图",zNodes);
			};
4.修改echarts-all.js源文件
项目需要自定义的鼠标右键菜单。但是低版本的echarts是没有开放右键菜单的。当然echarts3已经开放了鼠标右键。但是树图结构并不是我想要的展示方式。echarts树图如下
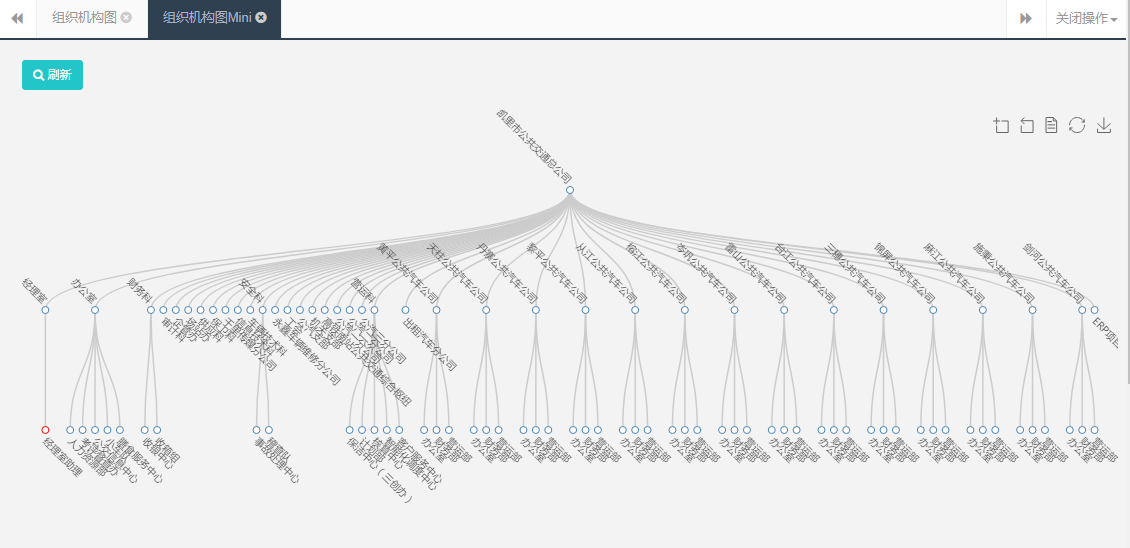
在其官方文档里点击打开链接并没有说明可以展示为直角图的例子及文档。
因项目需要,还是决定要修改2.2.7版本的echarts-all.js源文件。
如需要请查看本文档末的下载链接,包含修改后的echarts-all.js文件支持了自定义右键菜单和本人所建树图所有源码文件。
5.修改原文件后,就可以自定义右键菜单了
<style>
#menuuu {
	position: absolute;
	border: 1px outset #F6F6F6 !important;
	border-color: #FFFFFF;
	z-index: 10000;
	left: 300px;
	top: 200px;
	display: none;
	width: 100px;
	height: 35px;/*65*/
	background: #CCCCCC;
	filter: alpha(opacity : 80);
	/* opacity:0.8; */
	overflow: hidden;
}

#menuuu ul {
	padding-top: 5px;
	padding-left: 2px;
	margin: 0px;
	list-style-type: none;
	vertical-align: middle;
}

#menuuu ul li {
	padding: 0px;
	margin-top: 1px;
	border-top: 1px solid #F6F6F6 !important;
	border-bottom: 1px outset #F6F6F6 !important;
	border-color: #FFFFFF;
	font-family: "微软雅黑";
	width: 96px;
	font-size: 14px;
	vertical-align: middle;
	text-align: center;
}

#menuuu font {
	padding-left: 4px;
	vertical-align: top;
}
</style>
<script language="javascript">
	//禁用右键
	var tree = document.getElementById("echartDepId");
	tree.οncοntextmenu=function()
            {
               return false;
            }


	</script>
<div id="menuuu" onMouseLeave="this.style.display = 'none';">
		<div style="display:none"><span class="menuValue"></span></div>
		<ul>
			<!--右键弹出菜单-->
			<li id="menu_influence" onClick="rlzy_control_echartDepId.unUse();"
				onMouseOver="this.style.background = '#999999';"
				onMouseOut="this.style.background = '#CCCCCC';"><img
				src="<%=request.getContextPath()%>/modules/rlzy.control/component/echartsFile/sitemap.png" style="width: 16px;height: 16px"/><font>组织撤销</font></li>
			<%-- <li id="menu_blood" onClick="alert('组织撤销');"
				onMouseOver="this.style.background = '#999999';"
				onMouseOut="this.style.background = '#CCCCCC';"><img
				src="<%=request.getContextPath()%>/modules/rlzy.control/component/echartsFile/workflow.png" /><font>组织撤销</font></li> --%>

		</ul>
	</div>
//新加上鼠标右击事件
		   myEchart.on('contextmenu', function (params) {
		 		//console.log("右键事件");
			    //console.log(params);
			    showMenu(params);
			    param=params;
			    window.document.onclick = function(){//点击其他位置时隐藏已打开的右键菜单
		        	hideMenu()
		        }
		  	});
		    var showMenu = function(params){
		    	var menu = document.getElementById("menuuu");
			    var event = params.event;
			    var pageX = event.pageX;
			    var pageY = event.pageY;
			    menu.style.left = pageX-238 + 'px';
			    menu.style.top = pageY-118 + 'px';
			    menu.style.display = "block";
			    为右键菜单准备信息块的信息;
			    menu.getElementsByClassName("menuValue")[0].innerHTML = params.data.value+","+params.data.nodeStatus;
			}
		    var hideMenu = function(){
		    	if(document.getElementById("menuuu")){

					document.getElementById("menuuu").style.display = "none";
		    	}
			}
源文件下载链接:http://download.csdn.net/download/xieedeni/10175200