今天教大家搞事情。
效果如下:
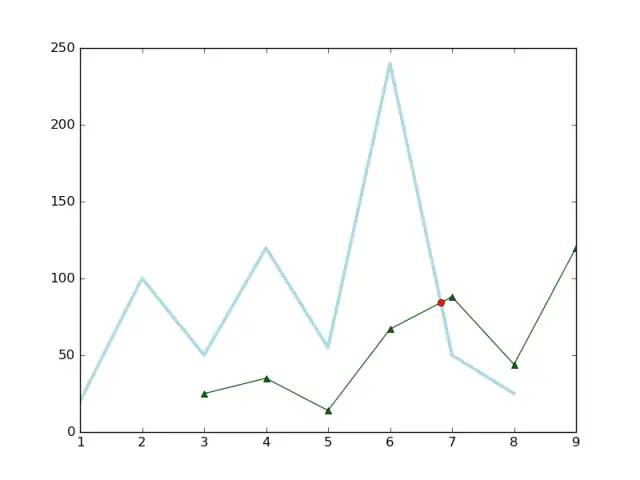
我们的目的是求得matplotlib中多个线条的交点位置以及坐标
最直白的想法是求得两条线的交点值,但是这个线是多个点的连线,所以每条线的function是非常难得到的,就算得到了也非常难联立求解。
于是我们选择通过渐进的方式逐渐逼近交点。
具体代码如下:
简单版本
先来个简单的函数:
import numpy as np
import matplotlib.pyplot as plt

fig = plt.figure()
ax = fig.add_subplot(111)

x1 = [1,2,3,4,5,6,7,8]
y1 = [20,100,50,120,55,240,50,25]
x2 = [3,4,5,6,7,8,9]
y2 = [25,35,14,67,88,44,120]

ax.plot(x1, y1, color='lightblue',linewidth=3)
ax.plot(x2, y2, color='darkgreen', marker='^')


# Plot the cross point

x3 = np.linspace(6, 7, 1000)        # (6, 7) intersection range
y1_new = np.linspace(240, 50, 1000) # (6, 7) corresponding to (240, 50) in y1
y2_new = np.linspace(67, 88, 1000)  # (6, 7) corresponding to (67, 88) in y2

idx = np.argwhere(np.isclose(y1_new, y2_new, atol=0.1)).reshape(-1)
ax.plot(x3[idx], y2_new[idx], 'ro')

plt.show()
这个函数需要我们先给出两条曲线相交处的大致y值,即代码中的
x3 = np.linspace(6, 7, 1000)        # (6, 7) intersection range
y1_new = np.linspace(240, 50, 1000) # (6, 7) corresponding to (240, 50) in y1
y2_new = np.linspace(67, 88, 1000)  # (6, 7) corresponding to (67, 88) in y2
具体思想是将6-7对应的y1,y2值得出,然后分为1000段,使用np.isclose(y1_new, y2_new, atol=0.1)逐渐逼近。
这个函数的作用是求得y1_new与y2_new差值是否<0.1,如果小于则对应位置返回true。
np.argwhere求得非0的index,即求得交点在6-7值中对应的位置。
由于比例是相同的,所以这个index即适用于x,也适用于y1,y2.
画出即可。
智能版本
下面放出更智能的版本:
# -*- coding: UTF-8 -*-
# 求曲线交点解决方案
import sys
if sys.getdefaultencoding() != 'utf-8':
reload(sys)
    sys.setdefaultencoding('utf-8')

import numpy as np
import matplotlib.pyplot as plt

fig = plt.figure()
ax = fig.add_subplot(111)

x1 = [1,2,3,4,5,6,7,8]
y1 = [20,100,50,120,55,240,50,25]
x2 = [3,4,5,6,7,8,9]
y2 = [25,35,14,67,88,44,120]

ax.plot(x1, y1, color='lightblue',linewidth=3)
ax.plot(x2, y2, color='darkgreen', marker='^')

# Get the common range, from `max(x1[0], x2[0])` to `min(x1[-1], x2[-1])`
x_begin = max(x1[0], x2[0])     # 3
x_end = min(x1[-1], x2[-1])     # 8

# 选出两曲线被包含的区间(有可能一个曲线长)
points1 = [t for t in zip(x1, y1) if x_begin<=t[0]<=x_end]  # [(3, 50), (4, 120), (5, 55), (6, 240), (7, 50), (8, 25)]
points2 = [t for t in zip(x2, y2) if x_begin<=t[0]<=x_end]  # [(3, 25), (4, 35), (5, 14), (6, 67), (7, 88), (8, 44)]

print(points1)
idx = 0
nrof_points = len(points1)
while idx < nrof_points-1:
# 将x1 - x2 之间的数据分段,如果两段直接没用相交的部分那么跳到下一个
    x3 = np.linspace(points1[idx][0], points1[idx+1][0], 1000)      # e.g., (6, 7) intersection range
    y1_new = np.linspace(points1[idx][1], points1[idx+1][1], 1000)  # e.g., (6, 7) corresponding to (240, 50) in y1
    y2_new = np.linspace(points2[idx][1], points2[idx+1][1], 1000)  # e.g., (6, 7) corresponding to (67, 88) in y2

    tmp_idx = np.argwhere(np.isclose(y1_new, y2_new, atol=0.1)).reshape(-1)
if tmp_idx:
        ax.plot(x3[tmp_idx], y2_new[tmp_idx], 'ro')                 # Plot the cross point

    idx += 1

plt.show()
该版本不需要用户提供y1,y2的range。其主要思想是从Xmin到Xmax逐个判断,直到找到交点。
while idx < nrof_points-1:从这里开始循环,从x最开始,依次加一,没有交点就接着循环,有交点就标注出来。
很简单吧哈哈哈哈
代码参考:https://stackoverflow.com/questions/37576527/finding-the-point-of-intersection-of-two-line-graphs-drawn-in-matplotlib