实验环境:准备三台虚拟机,本文用Centos7为例;
我这里所使用的的虚拟机地址分别为:
主机名:                IP
prometheus.weme     192.168.10.63
agent.weme          192.168.10.64
grafana.weme        192.168.10.65
分别进入每台虚拟机设置hostname:
hostnamectl set-hostname prometheus.weme;exit
hostnamectl set-hostname agent.weme;exit
hostnamectl set-hostname grafana.weme;exit
#在每台虚拟机的/etc/hosts文件中加入以下内容(IP改成真实的IP地址):
ip prometheus.weme
ip agent.weme
ip grafana.weme
192.168.10.63 prometheus.weme
192.168.10.64 agent.weme
192.168.10.65 grafana.weme
每台虚拟机同步时间:
yum install -y ntpdate
ntpdate -u cn.pool.ntp.org
cp /usr/share/zoneinfo/Asia/Shanghai /etc/localtime
watch -n 1 date
优化每台Linux系统
sed -i 's/SELINUX=enforcing/SELINUX=disabled/' /etc/selinux/config &> /dev/null
setenforce 0
systemctl stop firewalld &> /dev/null
systemctl disable firewalld &> /dev/null
iptables -F
systemctl stop NetworkManager &> /dev/null
systemctl disable NetworkManager &> /dev/null
echo 1 > /proc/sys/net/ipv4/ip_forward
安装prometheus(登录到prometheus主机)
下载后解压就可以使用,不需要编译!
下载:
wget https://github.com/prometheus/prometheus/releases/download/v2.5.0/prometheus-2.5.0.linux-amd64.tar.gz
[root@prometheus ~]# wget https://github.com/prometheus/prometheus/releases/download/v2.5.0/prometheus-2.5.0.linux-amd64.tar.gz
--2022-12-12 14:06:24-- https://github.com/prometheus/prometheus/releases/download/v2.5.0/prometheus-2.5.0.linux-amd64.tar.gz
正在解析主机 github.com (github.com)... 20.205.243.166
正在连接 github.com (github.com)|20.205.243.166|:443... 已连接。
已发出 HTTP 请求,正在等待回应... 302 Found
位置:https://objects.githubusercontent.com/github-production-release-asset-2e65be/6838921/24b4a380-e1d2-11e8-9e9b-34005dbbd986?X-Amz-Algorithm=AWS4-HMAC-SHA256&X-Amz-Credential=AKIAIWNJYAX4CSVEH53A%2F20221212%2Fus-east-1%2Fs3%2Faws4_request&X-Amz-Date=20221212T060625Z&X-Amz-Expires=300&X-Amz-Signature=a9fa9ae60353713270a3513499696c9431b9b0b2dc355175b769d26f5a6f55aa&X-Amz-SignedHeaders=host&actor_id=0&key_id=0&repo_id=6838921&response-content-disposition=attachment%3B%20filename%3Dprometheus-2.5.0.linux-amd64.tar.gz&response-content-type=application%2Foctet-stream [跟随至新的 URL]
--2022-12-12 14:06:25-- https://objects.githubusercontent.com/github-production-release-asset-2e65be/6838921/24b4a380-e1d2-11e8-9e9b-34005dbbd986?X-Amz-Algorithm=AWS4-HMAC-SHA256&X-Amz-Credential=AKIAIWNJYAX4CSVEH53A%2F20221212%2Fus-east-1%2Fs3%2Faws4_request&X-Amz-Date=20221212T060625Z&X-Amz-Expires=300&X-Amz-Signature=a9fa9ae60353713270a3513499696c9431b9b0b2dc355175b769d26f5a6f55aa&X-Amz-SignedHeaders=host&actor_id=0&key_id=0&repo_id=6838921&response-content-disposition=attachment%3B%20filename%3Dprometheus-2.5.0.linux-amd64.tar.gz&response-content-type=application%2Foctet-stream
正在解析主机 objects.githubusercontent.com (objects.githubusercontent.com)... 185.199.110.133, 185.199.109.133, 185.199.111.133
正在连接 objects.githubusercontent.com (objects.githubusercontent.com)|185.199.110.133|:443... 已连接。
已发出 HTTP 请求,正在等待回应... 200 OK
长度:36142430 (34M) [application/octet-stream]
正在保存至: “prometheus-2.5.0.linux-amd64.tar.gz”
100%[=========================================================>] 36,142,430 1.03MB/s 用时 3m 57s
2022-12-12 14:10:40 (149 KB/s) - 已保存 “prometheus-2.5.0.linux-amd64.tar.gz” [36142430/36142430])
解压、移动、重命名:
tar xvf prometheus-2.5.0.linux-amd64.tar.gz -C /usr/local
mv /usr/local/prometheus-2.5.0.linux-amd64/ /usr/local/prometheus
mkdir /etc/prometheus
cp /usr/local/prometheus/prometheus.yml /etc/prometheus/
启动:
nohup /usr/local/prometheus/prometheus --config.file="/etc/prometheus/peometheus.yml" &
默认端口是9090
查看端口占用情况:
netstat -pantul |grep 9090
lsof -i:9090
ss -naltp | grep 9090
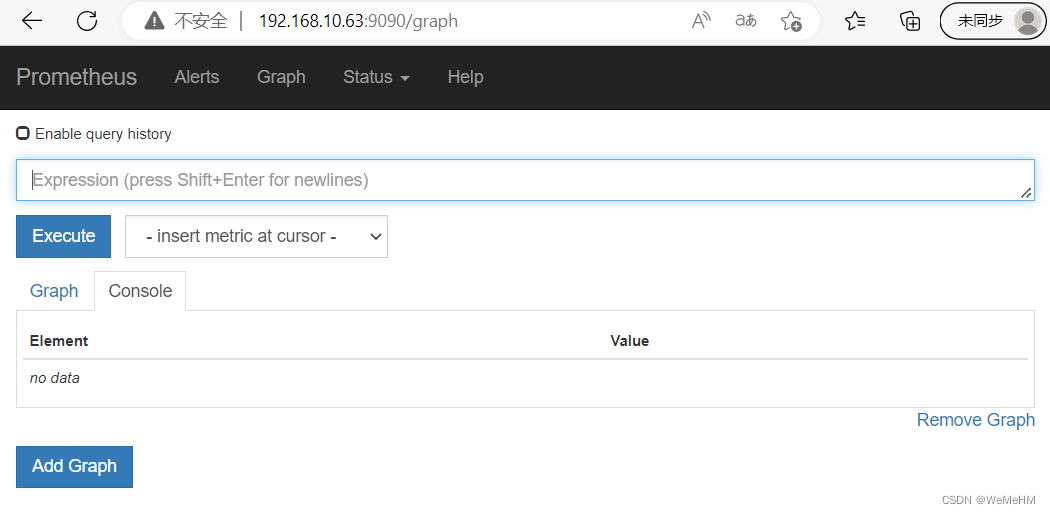
此时,浏览器输入http://192.168.10.63:9090即可访问到prometheus的主界面
安装node_exporter监控远程Linux主机(登录到agent机器)
下载
wget https://github.com/prometheus/node_exporter/releases/download/v0.16.0/node_exporter-0.16.0.linux-amd64.tar.gz
tar xvf node_exporter-0.16.0.linux-amd64.tar.gz -C /usr/local/
mv /usr/local/node_exporter-0.16.0.linux-amd64/ /usr/local/node_exporter
nohup /usr/local/node_exporter/node_exporter &
netstat -pantul | grep 9100
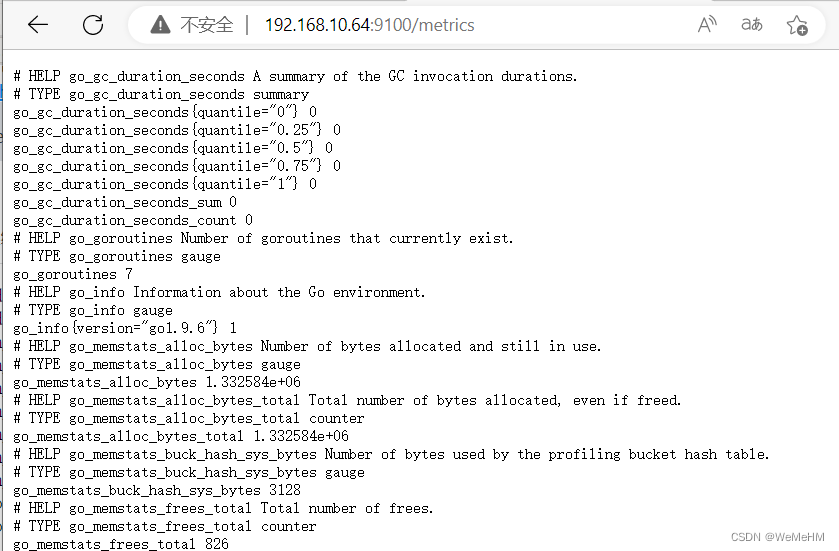
打开浏览器输入:http://192.168.10.64:9100/metrics就可以看到监控信息了
将该监控添加到prometheus监控软件,登录到prometheus机器
修改prometheus.yml
vim /etc/prometheus/prometheus.yml
末尾添加以下内容:
- job_name: 'agent'
static_configs:
- targets: ['192.168.10.64:9100']
###注意格式问题!!!
动态更新prometheus.yml配置
ps -aux | grep prometheus
kill -HUP 进程号 (#如果想要更改配置而不需停止并重新启动服务,就使用此命令。)
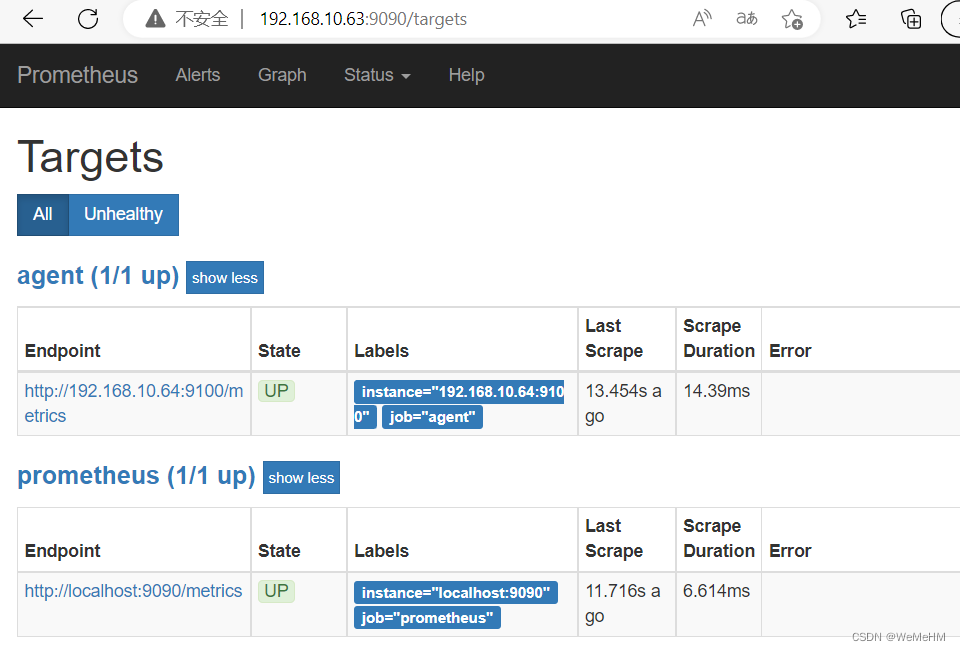
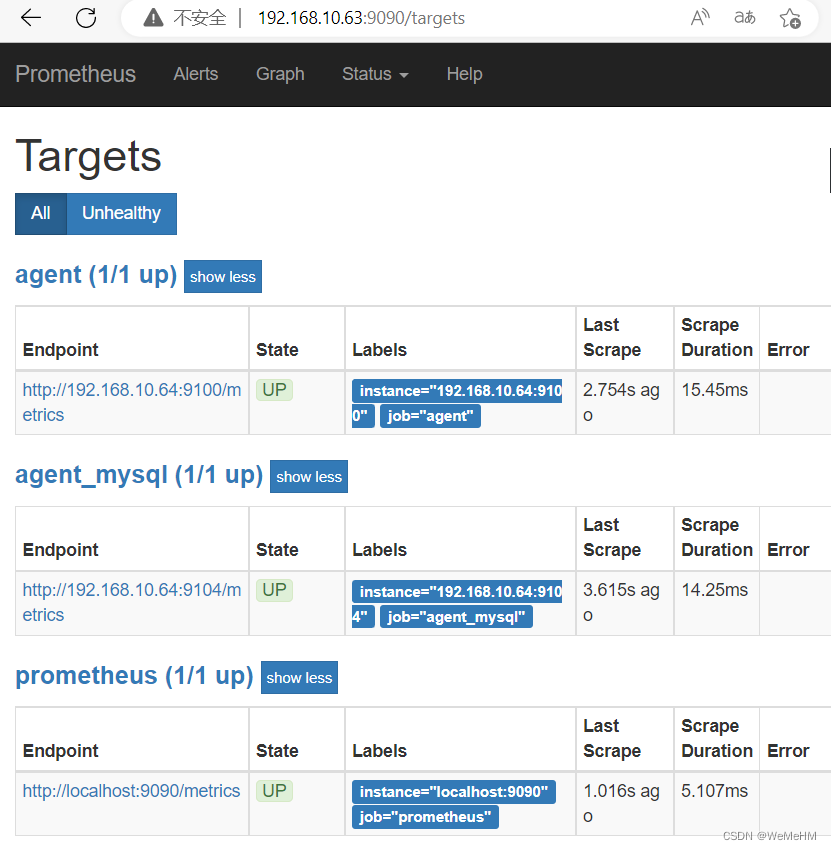
去控制台查看 http://192.168.10.63:9090/targets
在agent机器添加一个mysql监控
wget https://github.com/prometheus/mysqld_exporter/releases/download/v0.11.0/mysqld_exporter-0.11.0.linux-amd64.tar.gz
tar xvf mysqld_exporter-0.11.0.linux-amd64.tar.gz -C /usr/local/
mv /usr/local/mysqld_exporter-0.11.0.linux-amd64/ /usr/local/mysqld_exporter
#安装数据库
yum install -y mariadb-server mariadb
systemctl start mariadb
systemctl enable mariadb
#初始化数据库
mysql_secure_installation
#创建一个数据库配置文件,写上连接的用户名与密码(和上面的授权的用户名和密码要对应)
vim /usr/local/mysqld_exporter/.my.cnf
[client]
user=用户名
password=密码
nohup /usr/local/mysqld_exporter/mysqld_exporter --config.my-cnf=/usr/local/mysqld_exporter/.my.cnf &
确认端口(9104)
netstat -pantul | grep 9104
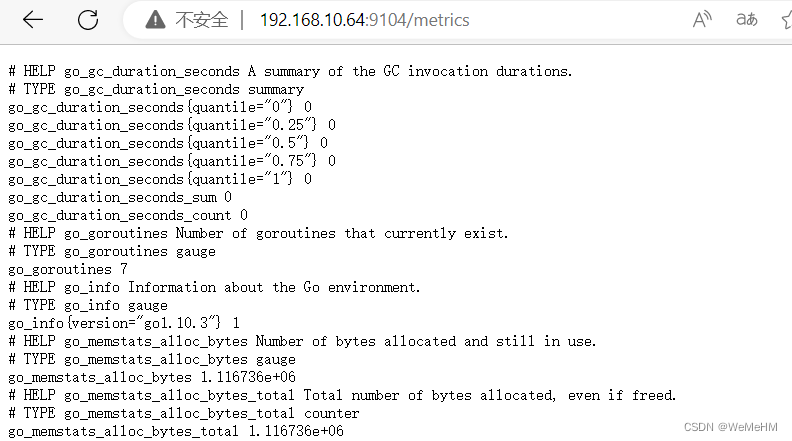
浏览器输入: http://192.168.10.64:9104/metrics就可以看到监控信息。
将此监控添加到prometheus监控软件,登录到prometheus机器。
编辑以下内容:
vim /etc/prometheus/prometheus.yml
#末尾添加以下内容:
- job_name: 'agent_mysql'
static_configs:
- targets: ['192.168.10.64:9104']
##一定要注意格式问题!!!
ps -aux | grep prometheus
kill -HUP 进程号
再次去浏览器页面观察是否添加成功
http://192.168.10.63:9090/targets
安装grafana(去到grafana机器)
wget https://dl.grafana.com/oss/release/grafana-5.3.4-1.x86_64.rpm
yum install -y fontconfig urw-fonts
rpm -ivh grafana-5.3.4-1.x86_64.rpm
#启动
systemctl start grafana-server
systemctl enable grafana-server
#检查端口
netstat -pantul | grep 3000
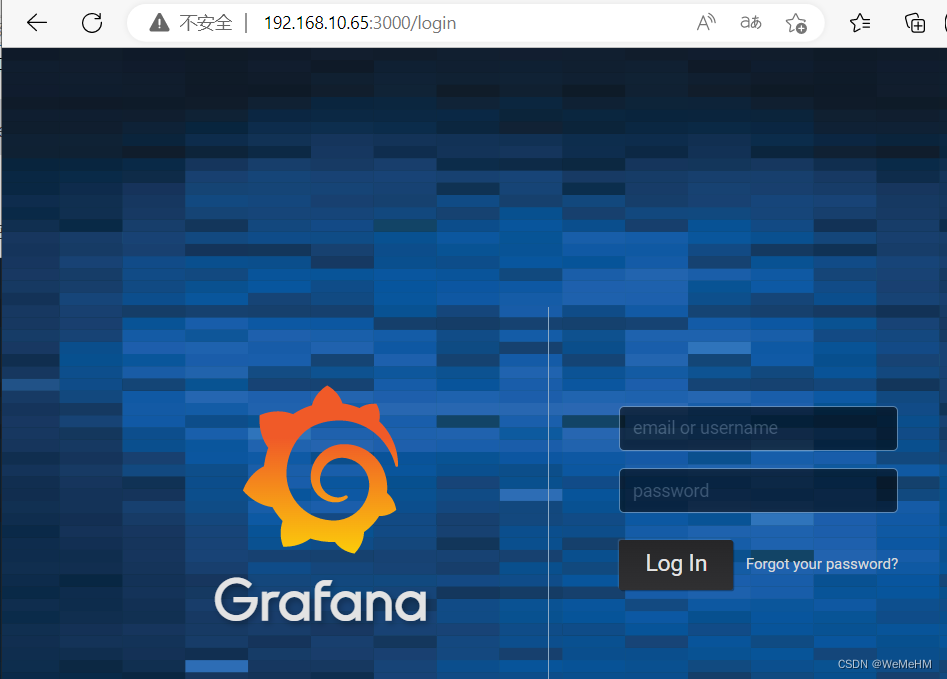
打开浏览器输入:http://192.168.10.65:3000查看是否成功运行。
默认用户名和密码是admin和admin

首次登录grafana后系统要求更改登录密码!

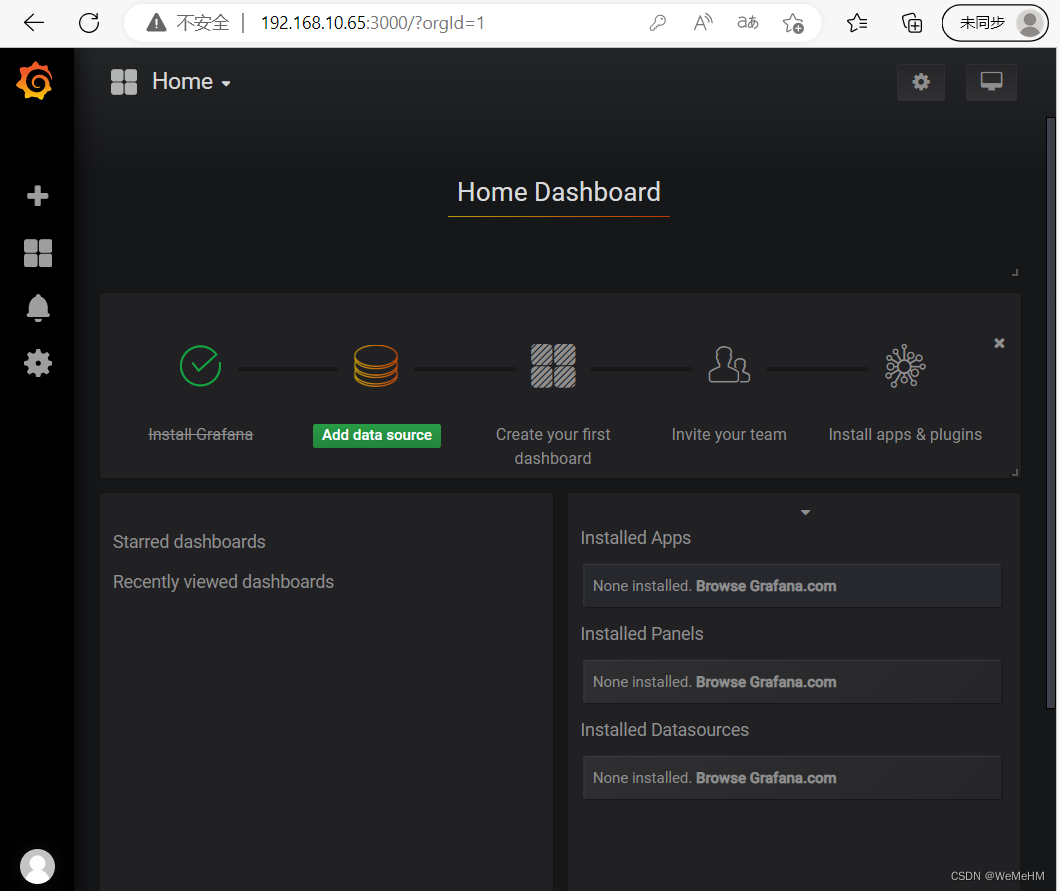
至此Prometheus环境搭建成功!!
本文内容由网友自发贡献,版权归原作者所有,本站不承担相应法律责任。如您发现有涉嫌抄袭侵权的内容,请联系:hwhale#tublm.com(使用前将#替换为@)