前言
在我们使用神经网络的过程中,经常会好奇中间的网络到底学到了些什么,所以常常想用可视化的方法来输出这些特征层,所以惊天带大家用一个简易的网络来输出这些特征层。
搭建网络
from torch import nn
import torch
from torch.nn import functional as F
import cv2
from matplotlib import pyplot as plt
class Net(nn.Module):
def __init__(self):
super().__init__()
self.conv1=nn.Conv2d(3,6,5)
self.pool1=nn.MaxPool2d(4,4)
self.conv2=nn.Conv2d(6,16,5)
self.pool2=nn.MaxPool2d(4,4)
def forward(self,x):
output=[]
x=self.conv1(x)
output.append(x)
x=F.relu(x)
output.append(x)
x=self.pool1(x)
output.append(x)
x=self.conv2(x)
output.append(x)
x=F.relu(x)
output.append(x)
x=self.pool2(x)
return x,output
net=Net()
导入图像,并进行前向传播
path="dog.png"
img=cv2.imread(path)
img=cv2.cvtColor(img, cv2.COLOR_BGR2RGB)
img=torch.tensor(img,dtype=torch.float32)
img=torch.permute(img,(2,0,1))
print(img.shape)
_,output=net(img)
打印特征层
for layer in output:
fig = plt.figure()
layer = layer.detach().numpy()
print(layer.shape)
plt.subplots_adjust(wspace=0.05, hspace=0)
for i in range(layer.shape[0]):
ax = fig.add_subplot(2, layer.shape[0]//2, i + 1, xticks=[], yticks=[])
plt.imshow(layer[i,:,:],cmap="gray")
plt.show()
效果展示
卷积层输出
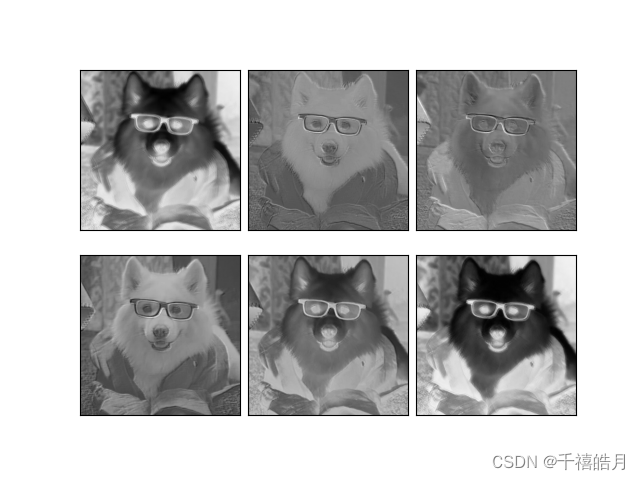
Relu之后
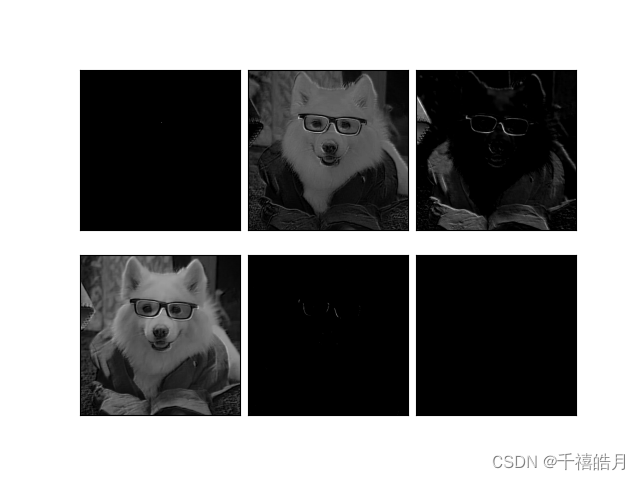
池化之后

完整源代码
from torch import nn
import torch
from torch.nn import functional as F
import cv2
from matplotlib import pyplot as plt
class Net(nn.Module):
def __init__(self):
super().__init__()
self.conv1=nn.Conv2d(3,6,5)
self.pool1=nn.MaxPool2d(4,4)
self.conv2=nn.Conv2d(6,16,5)
self.pool2=nn.MaxPool2d(4,4)
def forward(self,x):
output=[]
x=self.conv1(x)
output.append(x)
x=F.relu(x)
output.append(x)
x=self.pool1(x)
output.append(x)
x=self.conv2(x)
output.append(x)
x=F.relu(x)
output.append(x)
x=self.pool2(x)
return x,output
net=Net()
path="dog.png"
img=cv2.imread(path)
img=cv2.cvtColor(img, cv2.COLOR_BGR2RGB)
img=torch.tensor(img,dtype=torch.float32)
img=torch.permute(img,(2,0,1))
print(img.shape)
_,output=net(img)
for layer in output:
fig = plt.figure()
layer = layer.detach().numpy()
print(layer.shape)
plt.subplots_adjust(wspace=0.05, hspace=0)
for i in range(layer.shape[0]):
ax = fig.add_subplot(2, layer.shape[0]//2, i + 1, xticks=[], yticks=[])
plt.imshow(layer[i,:,:],cmap="gray")
plt.show()
本文内容由网友自发贡献,版权归原作者所有,本站不承担相应法律责任。如您发现有涉嫌抄袭侵权的内容,请联系:hwhale#tublm.com(使用前将#替换为@)