项目名称:基于docker- swarm 搭建docker高可用集群
1、网络拓扑图
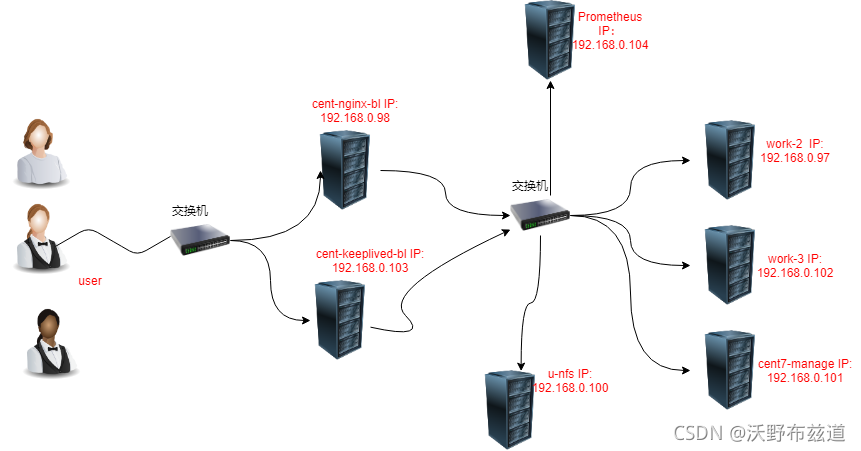
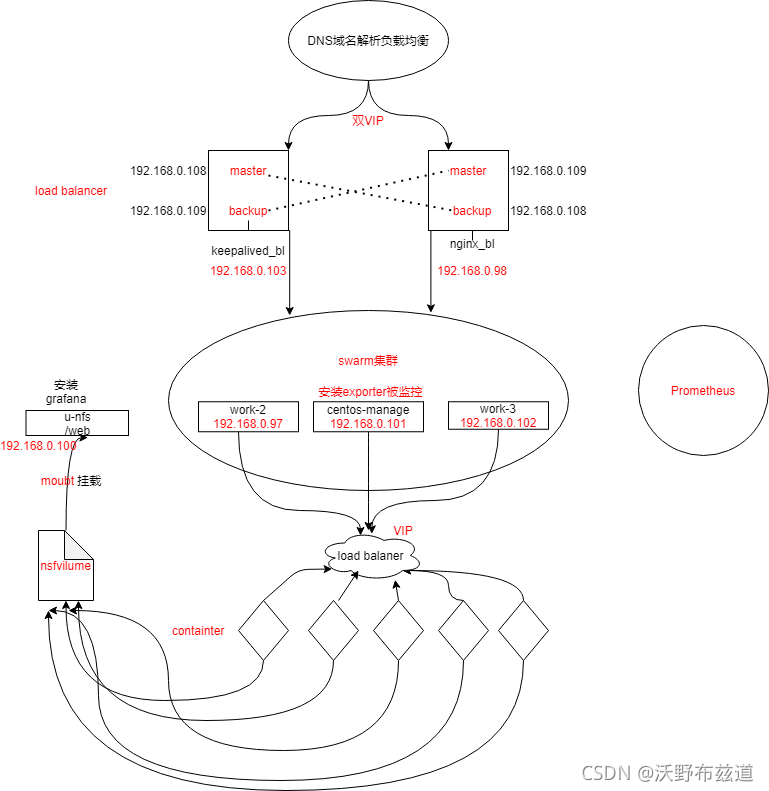
网络数据流图
2、项目环境
Docker 20.10.8,CentOS 7.6(7台 1核1G),Nginx 1.19.7,Prometheus2.29.1,Grafana8.1.2,Keepalived,NFS。
3、项目描述
实现一个高可用的负载均衡Web服务器集群,后端采用Swarm管理的Docker集群来提供Web服务,大量使用容器来完成Web服务的扩展性、高可用性,使用Prometheus对整个集群进行监控,保证业务正常进行。
4、项目步骤
1.规划设计整个集群的架构、网络拓扑,安装7台CentOS 7.6的系统,按照规划配置好每台linux的IP,准备好Docker环境,搭建swarm集群
1、创建swarm集群
[root@centos-7 ~]# docker swarm init --advertise-addr 192.168.0.101
Swarm initialized: current node (wxfmm8k75qxwey2fufk204ivv) is now a manager.

To add a worker to this swarm, run the following command:
    # 这就是添加节点的方式(要保存初始化后token,因为在节点加入时要使用token作为通讯的密钥
    docker swarm join --token SWMTKN-1-3sqv9hho99m8z686tspko5c5dn3pmk6h02p5zscduh3eq2nkm5-1h1g2xndxeit74aa2vy5304jo 192.168.0.101:2377

To add a manager to this swarm, run 'docker swarm join-token manager' and follow the instructions
2、添加节点主机到Swarm集群(如果想要将其他更多的节点添加到这个swarm集群中,添加方法与其一致)
[root@work_3 ~]# docker swarm join --token SWMTKN-1-3sqv9hho99m8z686tspko5c5dn3pmk6h02p5zscduh3eq2nkm5-1h1g2xndxeit74aa2vy5304jo 192.168.0.101:2377
This node joined a swarm as a worker.
2、使用Volume(挂载目录到NFS服务器下)来提供Web服务,达到所有容器都使用相同的数据;
1、共享文件,编辑/etc/exports文件,写好具体的共享的目录和权限
[root@u-nfs ~]# vim /etc/exports
/web  192.168.0.0/24(rw,all_squash,sync)
2、根据编辑的文件建立web文件
3、刷新输出文件的列表:
exportfs -rv
4、在manage机器上创建服务(注意swarm集群的机器也需要安装nfs服务):
docker service create -d --name nfs-web --mount 'type=volume,source=nfsvolume,target=/usr/share/nginx/html,volume-driver=local,volume-opt=type=nfs,volume-opt=device=:/web,"volume-opt=o=addr=192.168.0.100,rw,nfsvers=4,async"' --replicas 10 -p 8089:80 nginx:latest
3、编译安装Nginx,编写安装脚本,使用Nginx做负载均衡
负载均衡: 将用户的访问请求均衡的分散到后端的真正提供服务的机器上
负载均衡器: 实现负载均衡功能的一个机器
1、编写脚本
#!/bin/bash

#解决软件的依赖关系,需要安装的软件包
yum -y install zlib zlib-devel openssl openssl-devel pcre pcre-devel gcc gcc-c++ autoconf automake make psmisc net-tools lsof vim wget

#新建luogan用户和组
id  sanchuang || useradd sanchuang -s /sbin/nologin

#下载nginx软件
mkdir  /sanchuang99 -p
cd /sanchuang99
wget  http://nginx.org/download/nginx-1.21.1.tar.gz

#解压软件
tar xf nginx-1.21.1.tar.gz
#进入解压后的文件夹
cd nginx-1.21.1

#编译前的配置
./configure --prefix=/usr/local/scsanchuang99  --user=sanchuang --group=sanchuang  --with-http_ssl_module   --with-threads  --with-http_v2_module  --with-http_stub_status_module  --with-stream

#如果上面的编译前的配置失败,直接退出脚本
if (( $? != 0));then
  exit
fi
#编译
make -j 2
#编译安装
make  install

#修改PATH变量
echo  "PATH=$PATH:/usr/local/scsanchuang99/sbin" >>/root/.bashrc
#执行修改了环境变量的脚本
source /root/.bashrc


#firewalld and selinux

#stop firewall和设置下次开机不启动firewalld
service firewalld stop
systemctl disable firewalld

#临时停止selinux和永久停止selinux
setenforce 0
sed  -i '/^SELINUX=/ s/enforcing/disabled/' /etc/selinux/config

#开机启动
chmod +x /etc/rc.d/rc.local
echo  "/usr/local/scsanchuang99/sbin/nginx" >>/etc/rc.local
2、运行安装脚本
[root@load-balancer ~]# bash onekey_install_shediao_nginx_v10.sh
切换用户,加载修改了的PATH变量
[root@load-balancer ~]# su - root
3、配置Nginx的负载均衡功能
cd /usr/local/scsanchuang99/ 进入nginx编译安装指定的目录
[root@load-balancer scsanchuang99]# ls
client_body_temp  conf  fastcgi_temp  html  logs  proxy_temp  sbin  scgi_temp  uwsgi_temp
cd conf/ 进入配置文件的命令
[root@load-balancer conf]# ls
fastcgi.conf          fastcgi_params.default  mime.types          nginx.conf.default   uwsgi_params
fastcgi.conf.default  koi-utf                 mime.types.default  scgi_params          uwsgi_params.default
fastcgi_params        koi-win                 nginx.conf
scgi_params.default  win-utf
nginx.conf 是nginx的配置文件
编辑配置文件:
[root@load-balancer conf]# vim nginx.conf
http{

   upstream  xuweb {     #定义一个负载均衡器名字叫xuweb
        server 192.168.0.101:8089;
        server 192.168.0.102:8089;
        server 192.168.0.97:8089;

   }
 server {
        listen       80;          #监听80端口
        server_name  www.sc.com;  #为www.sc.com 域名服务
        location / {
                proxy_pass http://scweb ;     #调用负载均衡器
        }
.....省略很多配置
}
nginx -s reload 重新加载配置文件–》相当于重启了nginx服务
4、Keepalived的双vip实现高可用
单点: 整个架构中,只有一台服务器的地方
单点故障: 如果某台服务器down机会导致整个集群出现异常
如何解决单点故障,防止单点故障–》高可用
高可用: 一台出现问题,另外的机器可以顶替,继续保障整个集群的正常运转.
keepalived 是实现高可用的软件
1、安装和配置
在两台安装Nginx的负载k均衡器的基础上安装Keepalived
yum install keepalived -y
2.配置keepalived.conf文件,添加vip和相关信息
cd /etc/keepalived/
vim keepalived.conf
配置文件详细解释:
vrrp_instance VI_1 {       启动一个vrrp的实例 VI_1 实例名,可以自定义
    state MASTER        --》角色是master
    interface ens33      --》在哪个接口上监听vrrp协议,同时绑定vip到那个接口
    virtual_router_id 105 --》虚拟路由id(帮派) 0~255范围
    priority 120    ---》优先级  0~255
    advert_int 1  --》advert interval 宣告消息 时间间隔 1秒
    authentication {   认证
        auth_type PASS   认证的类型是密码认证  password
        auth_pass 11112222   具体的密码,可以自己修改
    }
    virtual_ipaddress {   --》vip的配置,vip可以是多个ip
        192.168.200.16
        192.168.200.17
        192.168.200.18
    }
}
cent-nginx-bl的详细配置:
! Configuration File for keepalived

global_defs {
   notification_email {
     acassen@firewall.loc
     failover@firewall.loc
     sysadmin@firewall.loc
   }
   notification_email_from Alexandre.Cassen@firewall.loc
   smtp_server 192.168.200.1
   smtp_connect_timeout 30
   router_id LVS_DEVEL
   vrrp_skip_check_adv_addr
  #vrrp_strict
   vrrp_garp_interval 0
   vrrp_gna_interval 0
}

vrrp_instance VI_1 {
    state MASTER
    interface ens33
    virtual_router_id 108
    priority 200
    advert_int 1
    authentication {
        auth_type PASS
        auth_pass 1111
    }
    virtual_ipaddress {
        192.168.0.108
    }
}

vrrp_instance VI_2 {
    state   BACKUP
    interface ens33
    virtual_router_id 109
    priority 100
    advert_int 1
    authentication {
        auth_type PASS
        auth_pass 1111
    }
    virtual_ipaddress {
        192.168.0.109
    }
}
cent-keepalived-bl的详细配置:
! Configuration File for keepalived

global_defs {
   notification_email {
     acassen@firewall.loc
     failover@firewall.loc
     sysadmin@firewall.loc
   }
   notification_email_from Alexandre.Cassen@firewall.loc
   smtp_server 192.168.200.1
   smtp_connect_timeout 30
   router_id LVS_DEVEL
   vrrp_skip_check_adv_addr
  #vrrp_strict
   vrrp_garp_interval 0
   vrrp_gna_interval 0
}

vrrp_instance VI_1 {
    state BACKUP
    interface ens33
    virtual_router_id 108
    priority 100
    advert_int 1
    authentication {
        auth_type PASS
        auth_pass 1111
    }
    virtual_ipaddress {
        192.168.0.108
    }
}

vrrp_instance VI_2 {
    state   MASTER
    interface ens33
    virtual_router_id 109
    priority 200
    advert_int 1
    authentication {
        auth_type PASS
        auth_pass 1111
    }
    virtual_ipaddress {
        192.168.0.109
    }
}
5、安装prometheus,在被监控的机器上安装exporter,实现监控功能
1、安装Prometheus
root@prometheus ~]# rz
[root@prometheus ~]# ls
   prometheus-2.29.1.linux-amd64.tar.gz
[root@prometheus ~]#
[root@prometheus ~]# mkdir /prometheus
[root@prometheus ~]# mv prometheus-2.29.1.linux-amd64.tar.gz /prometheus/
#临时添加环境变量
[root@prometheus prometheus]# PATH=$PATH:/prometheus/prometheus-2.29.1.linux-amd64
[root@prometheus prometheus]# which prometheus
/prometheus/prometheus-2.29.1.linux-amd64/prometheus
[root@prometheus prometheus]#
永久添加安装路径到PATH环境变量里
[root@prometheus ~]# vim /root/.bashrc
PATH=$PATH:/prometheus/prometheus-2.29.1.linux-amd64
prometheus 启动程序
prometheus.yml 配置文件
启动prometheus
[root@prometheus prometheus-2.29.1.linux-amd64]# ./prometheus --config.file=prometheus.yml
level=info ts=2021-08-25T09:23:53.236Z caller=main.go:390 msg="No time or size retention was set so using the default time retention" duration=15d
level=info ts=2021-08-25T09:23:53.237Z caller=main.go:428 msg="Starting Prometheus" version="(version=2.29.1, branch=HEAD, revision=dcb07e8eac34b5ea37cd229545000b857f1c1637)"
level=info ts=2021-08-25T09:23:53.237Z caller=main.go:433 build_context="(go=go1.16.7, user=root@364730518a4e, date=20210811-14:48:27)"
在后台启动prometheus
[root@prometheus prometheus-2.29.1.linux-amd64]# nohup ./prometheus --config.file=/prometheus/prometheus-2.29.1.linux-amd64/prometheus.yml &
2、在被监控的服务器上安装exporter
exporter : 是prometheus的客户端程序,需要安装到被监控的服务器上。exporter是一个程序,需要去定制,但是prometheus平台给我们开发了很多通用的或者定制的exporter
exporter会到客户机(被监控的服务器上)收集指定的指标数据,例如:cpu的使用率,内存的使用率,磁盘的使用情况,网络的带宽使用情况等等数据
上传下载的node_exporter-1.2.2.linux-amd64.tar.gz到被监控的服务器
[root@cent7-manage~]# rz
[root@cent7-manage ~]# ls
anaconda-ks.cfg  getting-started-master
echo.sh          getting-started-master.zip  node_exporter-1.2.2.linux-amd64.tar.gz  sc-ubuntu2.tar
[root@cent7-manage~]# mkdir /exporter
[root@cent7-manage~]# mv node_exporter-1.2.2.linux-amd64.tar.gz /exporter/
[root@cent7-manage ~]# cd /exporter/
[root@cent7-manage exporter]#
解压软件
[root@cent7-manage exporter]# tar xf node_exporter-1.2.2.linux-amd64.tar.gz
[root@cent7-manage exporter]# ls
node_exporter-1.2.2.linux-amd64  node_exporter-1.2.2.linux-amd64.tar.gz
[root@cent7-manage exporter]# cd node_exporter-1.2.2.linux-amd64
[root@cent7-manage node_exporter-1.2.2.linux-amd64]# ls
LICENSE  node_exporter  NOTICE
[root@cent7-manage node_exporter-1.2.2.linux-amd64]#
执行软件
[root@cent7-manage node_exporter-1.2.2.linux-amd64]# ./node_exporter --help

[root@cent7-manage node_exporter-1.2.2.linux-amd64]# nohup  ./node_exporter --web.listen-address="0.0.0.0:9100"  &
[1] 96546
[root@cent7-manage node_exporter-1.2.2.linux-amd64]# nohup: 忽略输入并把输出追加到'nohup.out'
查看进程
[root@cent7-manage node_exporter-1.2.2.linux-amd64]# ps aux|grep node
root       96546  0.1  0.2 716440 10996 pts/1    Sl   10:38   0:00 ./node_exporter --web.listen-address=0.0.0.0:9100
root       96551  0.0  0.0  12348  1144 pts/1    S+   10:38   0:00 grep --color=auto node
修改PATH环境变量
#临时修改
[root@cent7-manage node_exporter-1.2.2.linux-amd64]# PATH=/exporter/node_exporter-1.2.2.linux-amd64:$PATH
[root@cent7-manage node_exporter-1.2.2.linux-amd64]# which node_exporter
/exporter/node_exporter-1.2.2.linux-amd64/node_exporter
[root@cent7-manage node_exporter-1.2.2.linux-amd64]#
#永久修改
[root@cent7-manage node_exporter-1.2.2.linux-amd64]# vim /root/.bashrc
PATH=/exporter/node_exporter-1.2.2.linux-amd64:$PATH  在末尾添加
server去访问这个网址获取node上的metrics
http://192.168.0.101:9100/metrics
3.添加被监控服务器到prometheus server里
在server上操作
[root@prometheus prometheus-2.29.1.linux-amd64]# cd /prometheus/prometheus-2.29.1.linux-amd64
[root@prometheus prometheus-2.29.1.linux-amd64]#
[root@prometheus prometheus-2.29.1.linux-amd64]# vim prometheus.yml
scrape_configs:
  # The job name is added as a label `job=<job_name>` to any timeseries scraped from this config.
  - job_name: "prometheus"

    # metrics_path defaults to '/metrics'
    # scheme defaults to 'http'.

    static_configs:
      - targets: ["localhost:9090"]

#添加需要监控的服务器的信息
  - job_name: "swarm-manager"
    static_configs:
      - targets: ["192.168.0.101:9100"]
重启prometheus服务,因为没有专门的重启脚本,需要手工完成
先杀死原来的进程,然后再启动新的进程,启动新的进程会重启加载配置文件
[root@prometheus prometheus-2.29.1.linux-amd64]# ps aux|grep prome
root       2160  0.1  6.3 912304 63172 pts/2    Sl   10:06   0:07 ./prometheus --config.file=/prometheus/prometheus-2.29.1.linux-amd64/prometheus.yml
root       2265  0.0  0.0 112824   980 pts/2    S+   11:14   0:00 grep --color=auto prome
kill -9 2160 杀死进程
重新启动程序
[root@prometheus prometheus-2.29.1.linux-amd64]# nohup  prometheus --config.file=/prometheus/prometheus-2.29.1.linux-amd64/ometheus.yml &
[1] 2276
[root@prometheus prometheus-2.29.1.linux-amd64]# nohup: 忽略输入并把输出追加到"nohup.out"
6、添加Grafana,美观、强大的可视化监控指标展示工具
grafana 是一款采用 go
语言编写的开源应用,主要用于大规模指标数据的可视化展现,是网络架构和应用分析中最流行的时序数据展示工具,目前已经支持绝大部分常用的时序数据库。最好的参考资料就是官网(http://docs.grafana.org/)
1、安装
[root@u-nfs yum.repos.d]# vim grafana.repo
[root@u-nfs yum.repos.d]# cat grafana.repo
[grafana]
name=grafana
baseurl=https://packages.grafana.com/enterprise/rpm
repo_gpgcheck=1
enabled=1
gpgcheck=1
gpgkey=https://packages.grafana.com/gpg.key
sslverify=1
sslcacert=/etc/pki/tls/certs/ca-bundle.crt
[root@u-nfs yum.repos.d]# yum install grafana -y
启动:
[root@u-nfs yum.repos.d]# systemctl start grafana-server
查看进程
[root@u-nfs yum.repos.d]# ps aux|grep grafana
root      42897  0.0  0.0 169308   756 ?        Ss   11:31   0:00 gpg-agent --homedir /var/cache/dnf/grafana-ee12c6ab2813e349/pubring --use-standard-socket --daemon
grafana   43438  3.6  4.3 1229004 80164 ?       Ssl  11:34   0:01 /usr/sbin/grafana-server --config=/etc/grafana/grafana.ini--pidfile=/var/run/grafana/grafana-server.pid --packaging=rpm cfg:default.paths.logs=/var/log/grafana cfg:default.paths.data=/var/lib/grafana cfg:default.paths.plugins=/var/lib/grafana/plugins cfg:default.paths.provisioning=/etc/grafana/provisioning
root      43490  0.0  0.0  12324  1060 pts/1    S+   11:34   0:00 grep --color=auto grafana
查看端口
ss -anplut|grep grafana
tcp    LISTEN   0        128                     *:3000                 *:*      users:(("grafana-server",pid=43438,fd=8))
到web 浏览器里访问
http://192.168.0.100:3000
web登陆
默认账号和密码都是admin
添加监控项(PromQL里查询的指标)–》grafana帮助我们去出图展示 --》自己去添加监控项遇到:
1.对很多监控项的指标具体对应那个PromQL 语句我们不熟悉
2.如果监控的指标过多,操作笔记复杂
grafana有模板,模板里包含很多的重要的监控项,我们直接导入就可以了 grafana的模板,本质上是一个json格式的文件
5、 项目心得
1.提前规划好整个集群的架构,可以提高项目开展时效率,可以让我们更加清晰;
2.对本地hosts文件进行DNS集群域名解析记录,效果并不明显,考虑在前面加一个负载均衡器,实现论询效果;
3.通过整个项目更加深刻的理解了Docker的相关技术,使用Docker的集群解决方案比传统的集群解决方案更加快捷方便,Docker内部的高可用和负载均衡也非常不错;
4.通过实验锻炼了自己细心和trouble shooting的能力。