数据使用的是seborn内置数据
官网链接:https://seaborn.pydata.org/generated/seaborn.heatmap.html
data
import seaborn as sns
import matplotlib.pyplot as plt
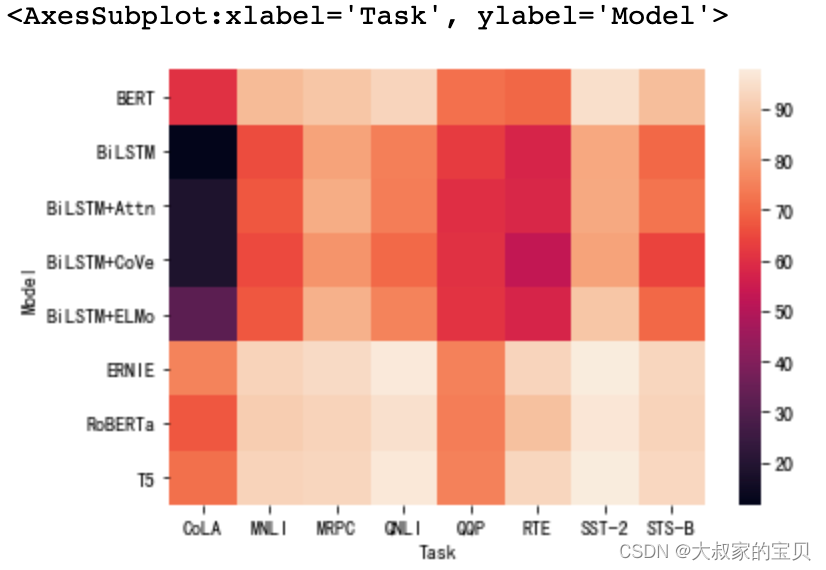
glue = sns.load_dataset('glue').pivot("Model","Task","Score")
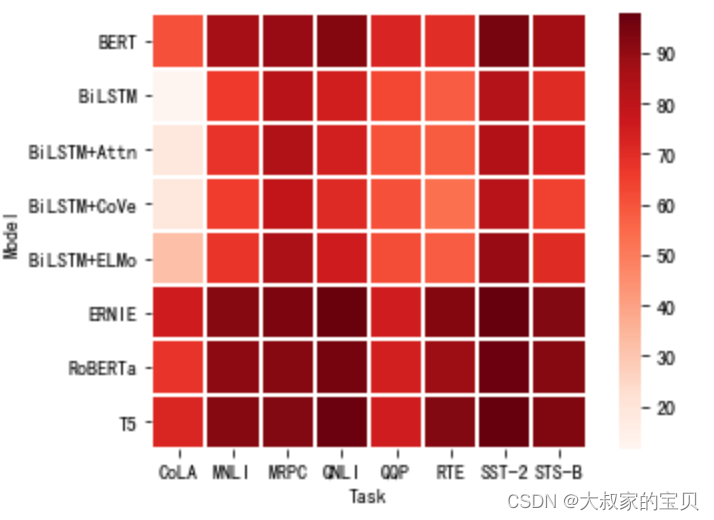
sns.heatmap(glue)
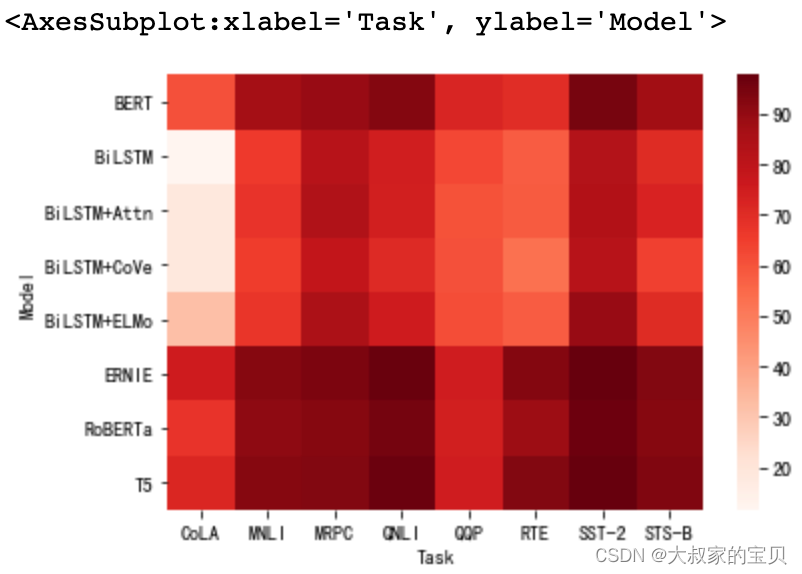
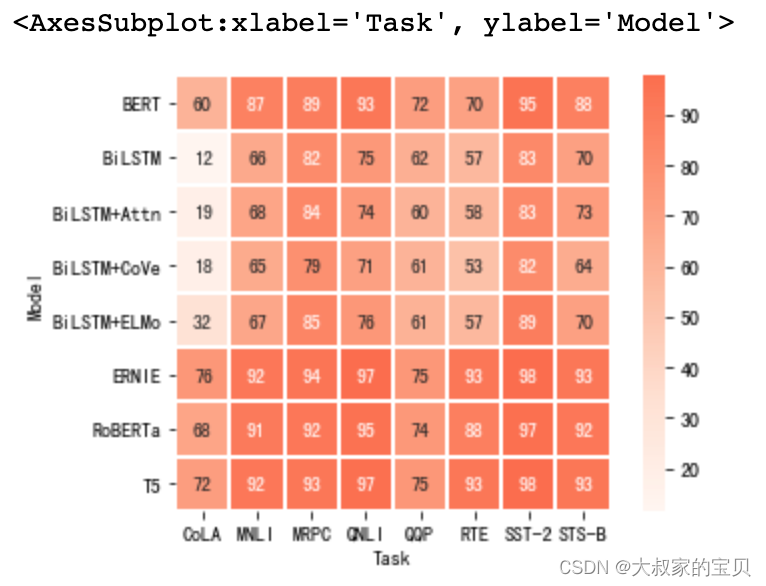
cmap
将数据值映射到颜色空间的不同颜色
cmap的可选值见另一篇博客:
https://blog.csdn.net/qq_43201025/article/details/131043840
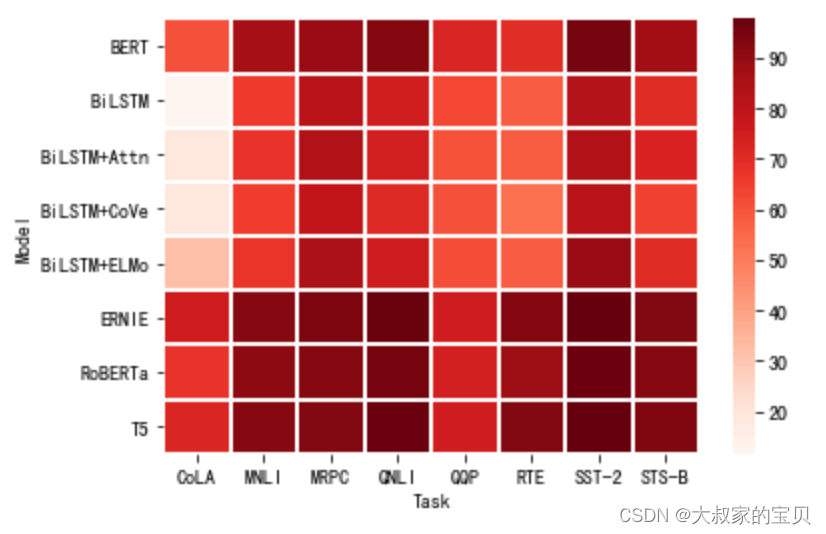
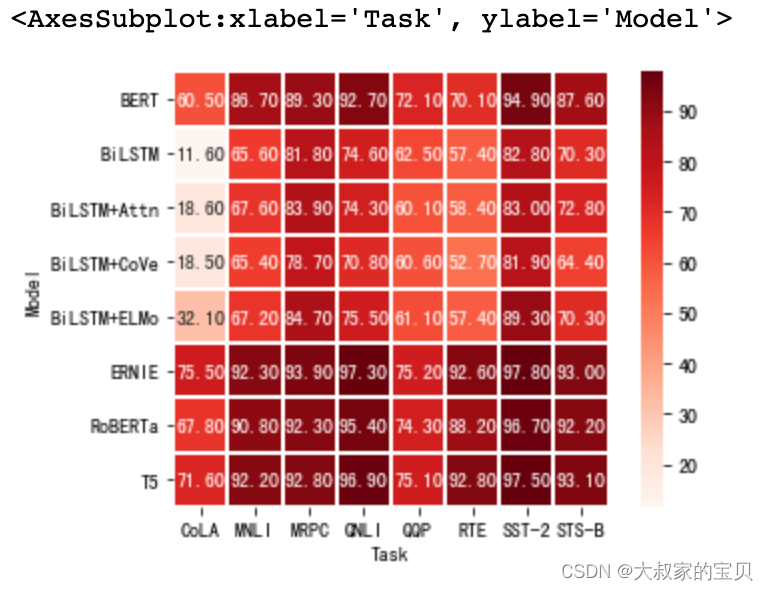
sns.heatmap(glue,cmap='Reds')
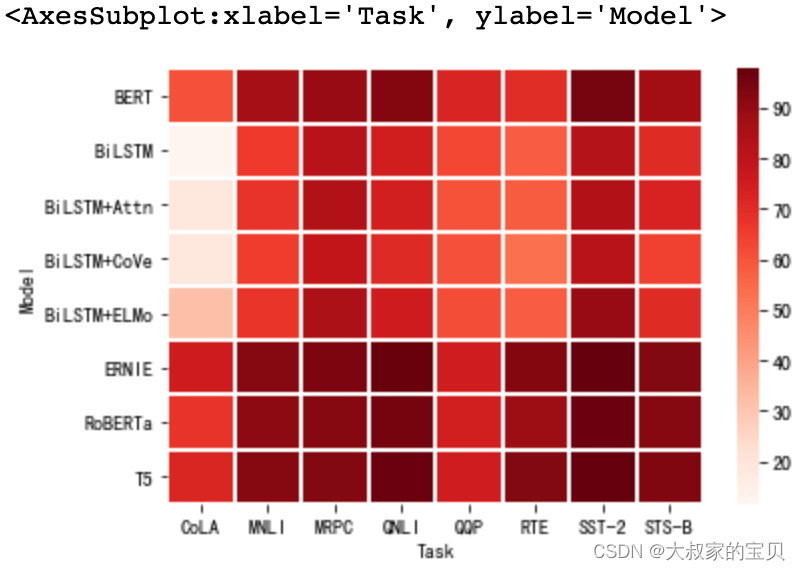
linewidths、linecolor
- linewidths:线条宽度
- linecolor:线条颜色
sns.heatmap(glue
            ,cmap='Reds'
            ,linewidths=0.1
            ,linecolor='white')
square
如果为True,则将坐标轴的两个轴设置为长短相同,也就相当于每个单元格都是方形的
sns.heatmap(glue
            ,cmap='Reds'
            ,linewidths=0.1
            ,linecolor='white'
            ,square=True)
ax
指定绘制的轴,一般在plt.subplots需要在一个画板画多个子图时使用
f,ax = plt.subplots(1,1)
sns.heatmap(glue
            ,cmap='Reds'
            ,linewidths=0.1
            ,linecolor='white'
            ,ax=ax)
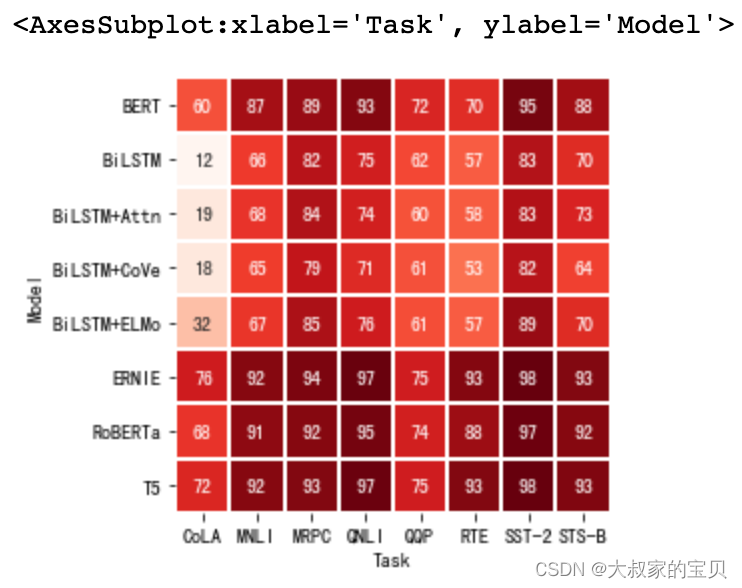
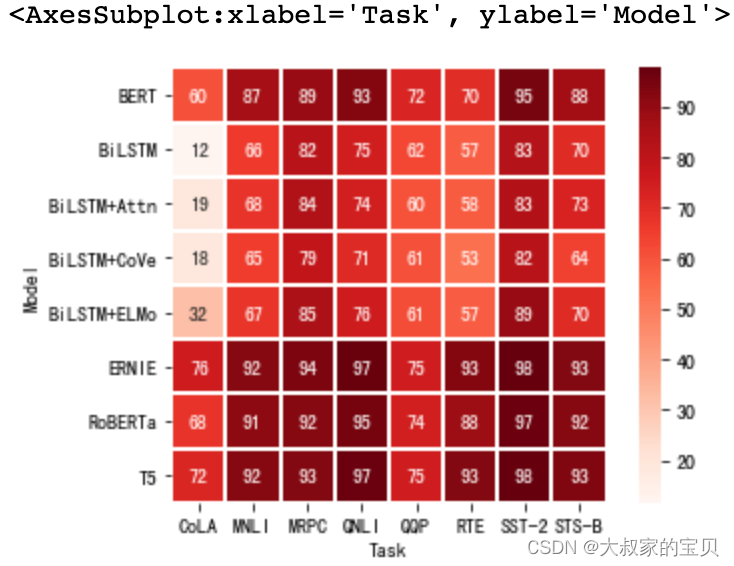
annot
如果为True,将数据值写入每个单元格。如果是与数据形状相同的数组,则将annot数组中的值写入热力图而不再是数据。
指定为True
sns.heatmap(glue
            ,cmap='Reds'
            ,linewidths=0.1
            ,linecolor='white'
            ,square=True
            ,annot=True)
指定为同形状数组
sns.heatmap(glue
            ,cmap='Reds'
            ,linewidths=0.1
            ,linecolor='white'
            ,square=True
            ,annot=np.random.randint(10,size=(8,8)))

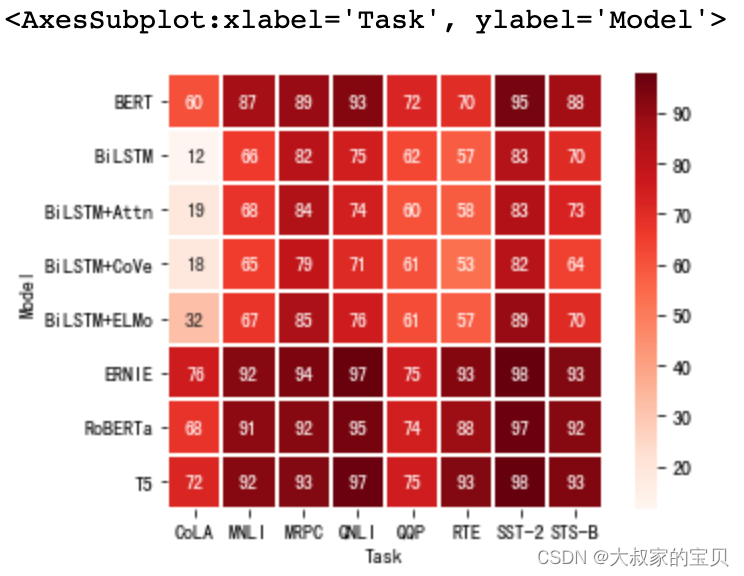
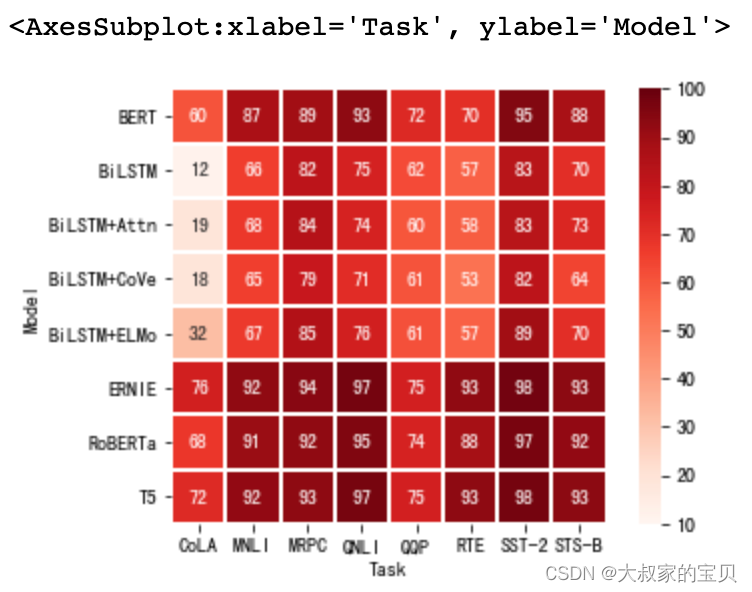
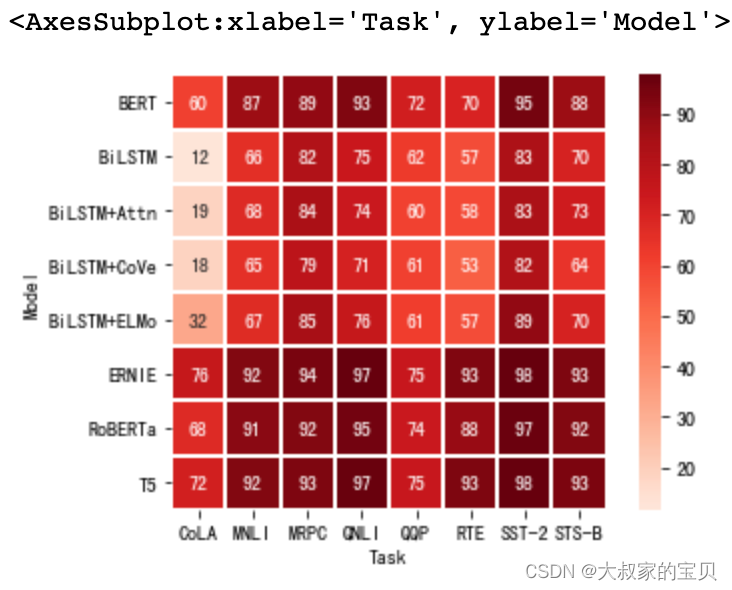
vmax、vmin
颜色映射的最大值和最小值,如果不指定,默认计算数据的最大值和最小值
sns.heatmap(glue
            ,cmap='Reds'
            ,linewidths=0.1
            ,linecolor='white'
            ,square=True
            ,annot=True
            ,vmax=glue.max().max()
            ,vmin=glue.min().min())
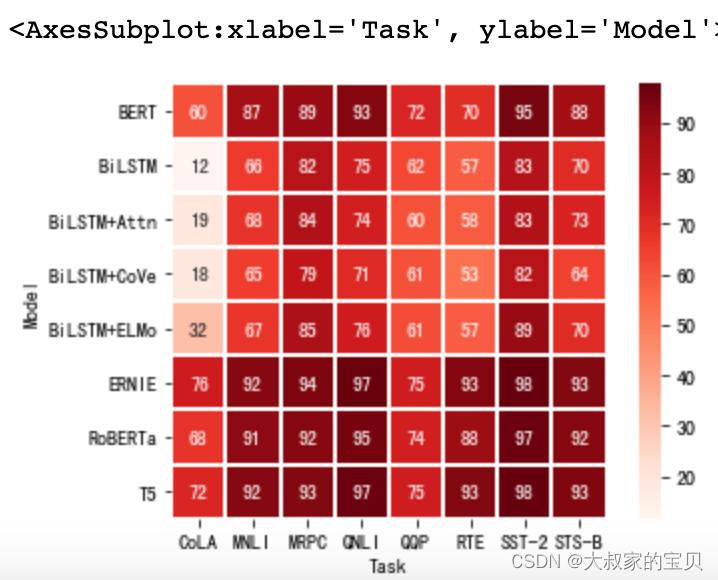
sns.heatmap(glue
            ,cmap='Reds'
            ,linewidths=0.1
            ,linecolor='white'
            ,square=True
            ,annot=True
            ,vmax=100
            ,vmin=10)
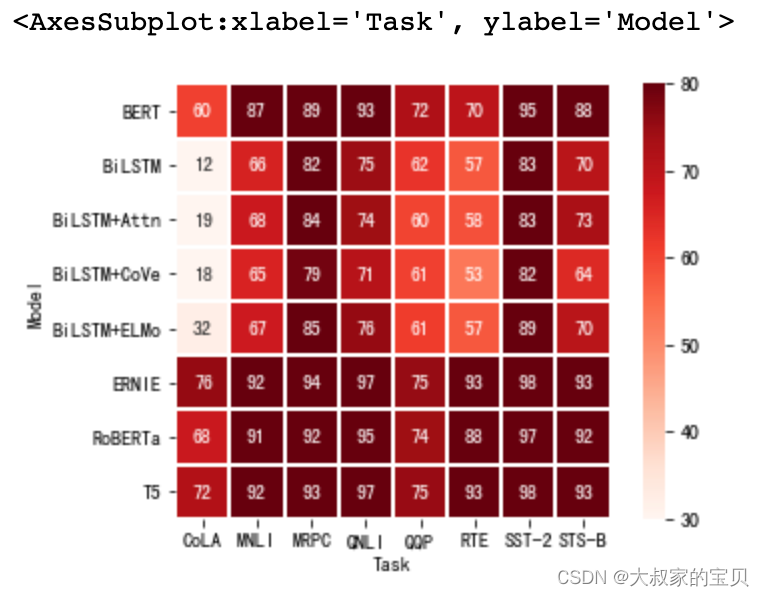
sns.heatmap(glue
            ,cmap='Reds'
            ,linewidths=0.1
            ,linecolor='white'
            ,square=True
            ,annot=True
            ,vmax=80
            ,vmin=30)
annot_kws
设置数字展示的参数,例如大小、颜色等
常用的有:
- fontfamily或family「字体类型」: {FONTNAME, ‘serif’, ‘sans-serif’, ‘cursive’, ‘fantasy’, ‘monospace’}
- fontsize或size「字体大小」: float or {‘xx-small’, ‘x-small’, ‘small’, ‘medium’, ‘large’, ‘x-large’, ‘xx-large’}
- fontweight或weight「粗细」: {a numeric value in range 0-1000, ‘ultralight’, ‘light’, ‘normal’, ‘regular’, ‘book’, ‘medium’, ‘roman’, ‘semibold’, ‘demibold’, ‘demi’, ‘bold’, ‘heavy’, ‘extra bold’, ‘black’}
- color「字体颜色」
- fontstyle或style「字体风格」: {‘normal’, ‘italic’, ‘oblique’}
具体设置见https://matplotlib.org/stable/api/_as_gen/matplotlib.axes.Axes.text.html#matplotlib.axes.Axes.text
sns.heatmap(glue
            ,cmap='Reds'
            ,linewidths=0.1
            ,linecolor='white'
            ,square=True
            ,annot=True
            ,annot_kws={
                "size": 12
                , "family": "serif"
                , "weight": "light"})
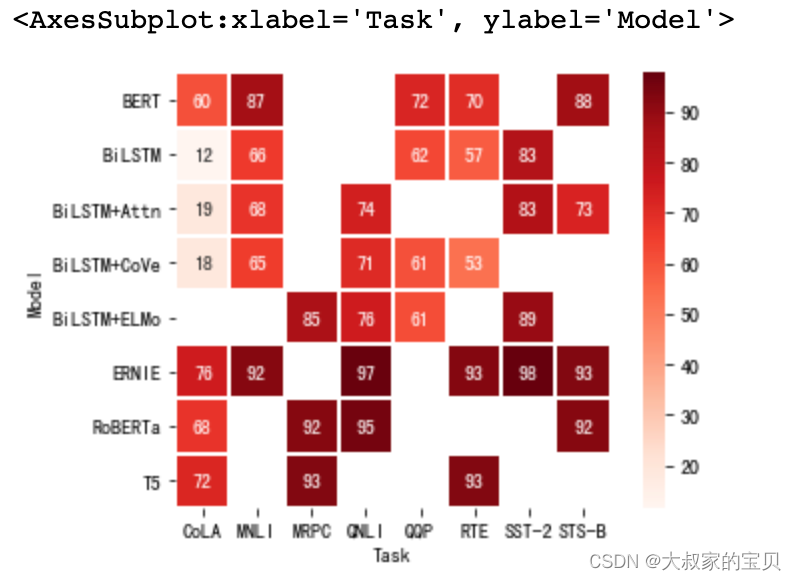
mask
如果使用该参数,数据将不会显示在mask为True的单元格中。缺少值的单元格将被自动屏蔽。
mask = (np.random.randint(2,size=(8,8))==0)
mask

sns.heatmap(glue
            , cmap='Reds'
            , linewidths=0.1
            , linecolor='white'
            , square=True
            , annot= True
            , mask=mask)
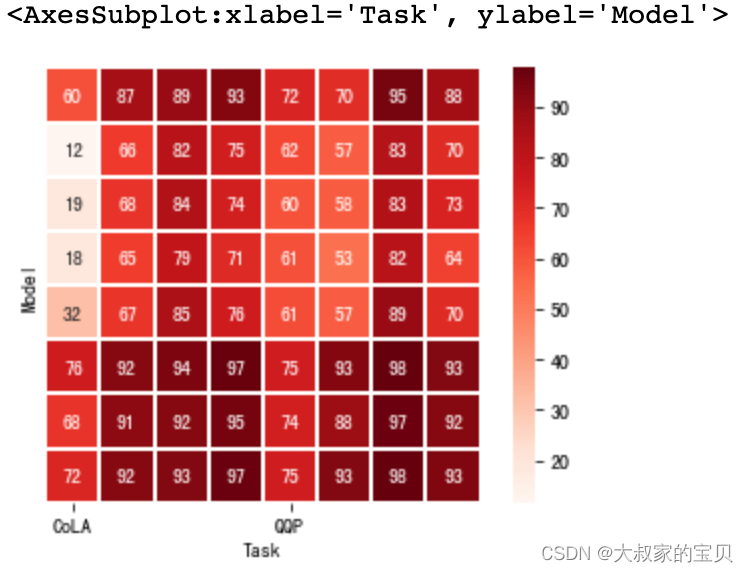
xticklabels、yticklabels
如果为True,默认使用数据的列名。如果为False,则不绘制列名。如果类似于列表,则将这些替代标签绘制为xticklabels。如果指定的是整数,则使用列名绘制,但每个n标签绘制一个。如果是“auto”,尝试密集地绘制不重叠的标签。
设置为auto
sns.heatmap(glue
            , cmap='Reds'
            , linewidths=0.1
            , linecolor='white'
            , square=True
            , annot= True
            , xticklabels='auto'
            , yticklabels=False
           )
指定整数
sns.heatmap(glue
            , cmap='Reds'
            , linewidths=0.1
            , linecolor='white'
            , square=True
            , annot= True
            , xticklabels=4
            , yticklabels=False
           )
指定为True
sns.heatmap(glue
            , cmap='Reds'
            , linewidths=0.1
            , linecolor='white'
            , square=True
            , annot= True
            , xticklabels=True
            , yticklabels=False
           )

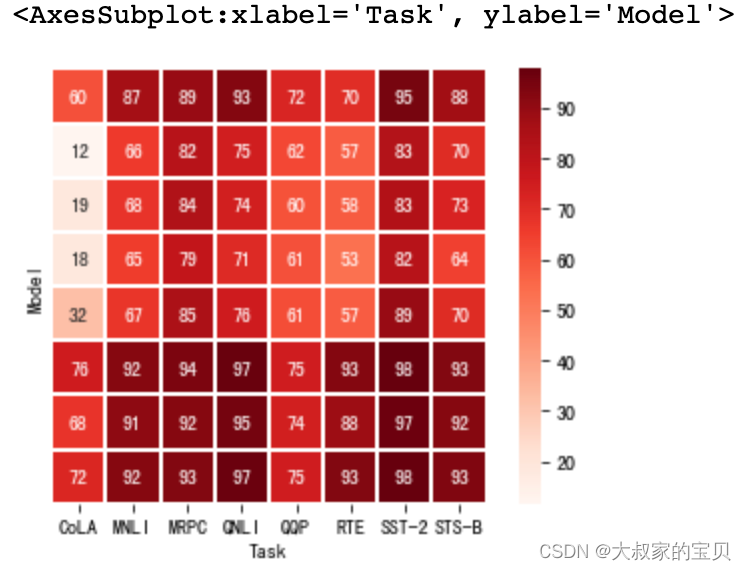
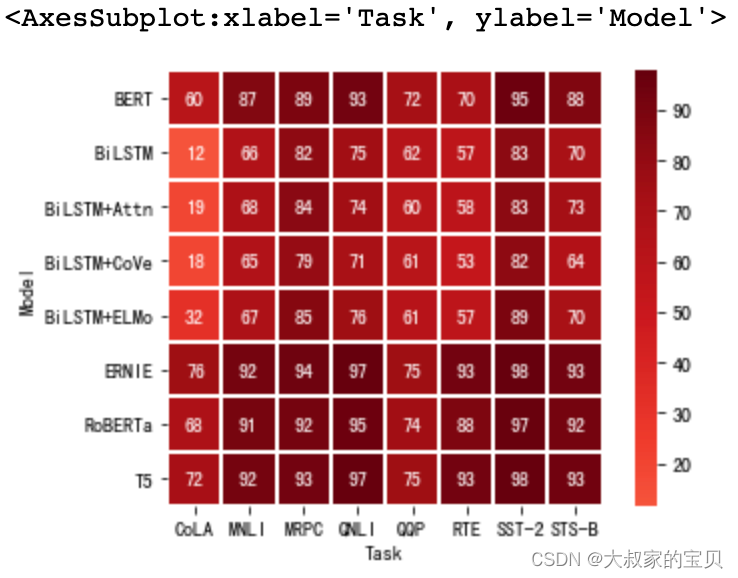
center
在绘制发散数据时使颜色图居中的值。如果没有指定,使用此参数将改变默认的cmap,还是会使用cmap的颜色,但是会改变对最大值到最小值之间颜色的渐变范围
sns.heatmap(glue
            , cmap='Reds'
            , linewidths=0.1
            , linecolor='white'
            , square=True
            , annot= True
            , center=0
           )
sns.heatmap(glue
            , cmap='Reds'
            , linewidths=0.1
            , linecolor='white'
            , square=True
            , annot= True
            , center=100
           )
sns.heatmap(glue
            , cmap='Reds'
            , linewidths=0.1
            , linecolor='white'
            , square=True
            , annot= True
            , center=50
           )
指定center前热力图为:
指定center前cmap='Reds’为

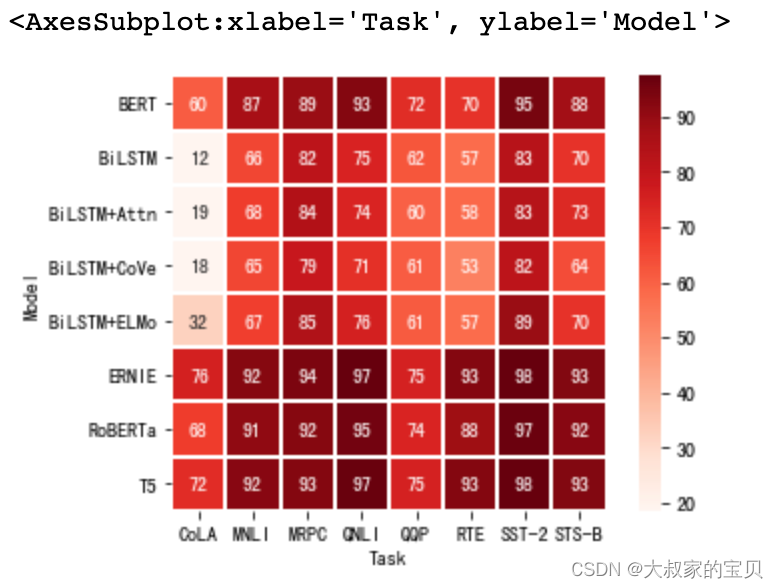
robust
如果为True,并且没有设置vmin、vmax则使用robust分位数来映射数据的颜色
sns.heatmap(glue
            , cmap='Reds'
            , linewidths=0.1
            , linecolor='white'
            , square=True
            , annot= True
            , robust=True
           )
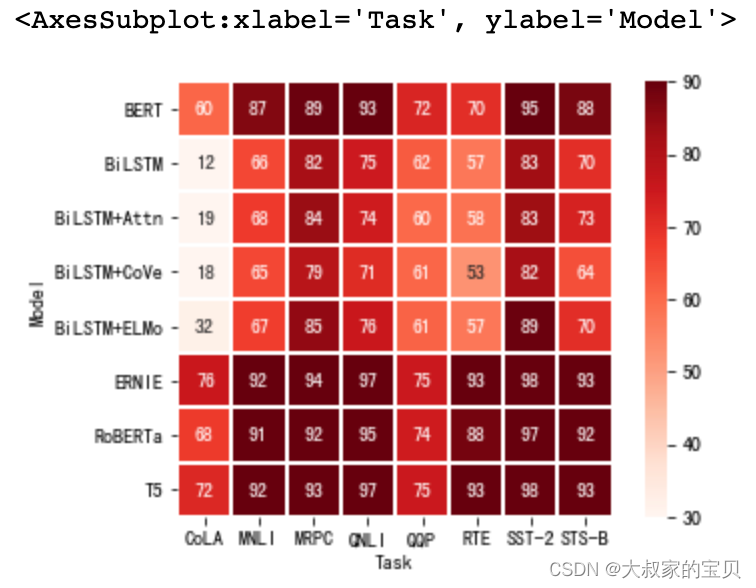
sns.heatmap(glue
            , cmap='Reds'
            , linewidths=0.1
            , linecolor='white'
            , square=True
            , annot= True
            , robust=True
            , vmax= 90
            , vmin=30
           )
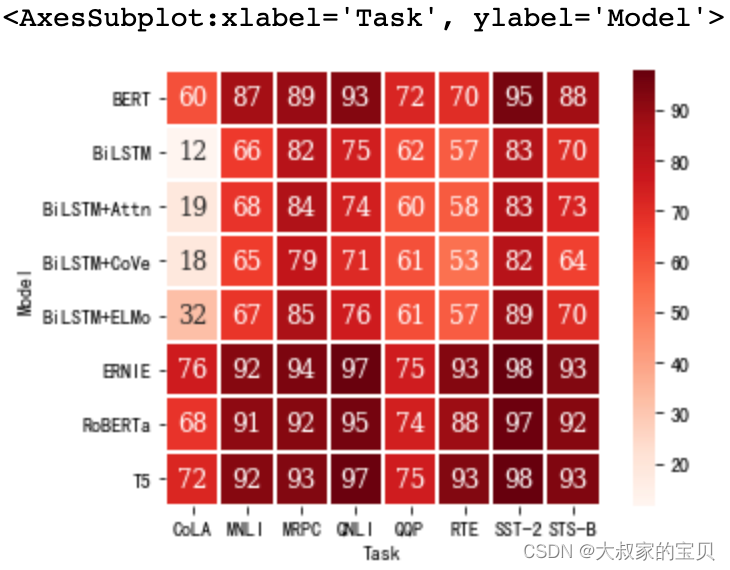
fmt
添加注释时使用的字符串格式化代码。
sns.heatmap(glue
            , cmap='Reds'
            , linewidths=0.1
            , linecolor='white'
            , square=True
            , annot= True
            , fmt='.2f'
           )
cbar
是否绘制颜色条
sns.heatmap(glue
            , cmap='Reds'
            , linewidths=0.1
            , linecolor='white'
            , square=True
            , annot= True
            , cbar= False
           )