#包装了一个异常值处理的代码,可以调用
def outliers_proc(data, col_name, scale=3):
    """
    用于清洗异常值,默认box_plot(scale=3)进行清洗
    param data: 接收pandas数据格式
    param col_name: pandas列名
    param scale: 尺度
    """

    def box_plot_outliers(data_ser, box_scale):
        """
        利用箱线图去除异常值
        :param data_ser: 接收 pandas.Series 数据格式
        :param box_scale: 箱线图尺度
        """
        iqr = box_scale * (data_ser.quantile(0.75) - data_ser.quantile(0.25))
        val_low = data_ser.quantile(0.25) - iqr
        val_up = data_ser.quantile(0.75) + iqr
        rule_low = (data_ser < val_low)
        rule_up = (data_ser > val_up)
        return (rule_low,rule_up),(val_low,val_up)

    data_n = data.copy()
    data_serier = data_n[col_name]
    rule, value = box_plot_outliers(data_serier,box_scale=scale)
    index = np.arange(data_serier.shape[0])[rule[0]|rule[1]]
    print("Delete number is:{}".format(len(index)))
    data_n = data_n.drop(index)
    data_n.reset_index(drop=True, inplace=True)
    print("Now column number is:{}".format(data_n.shape[0]))
    index_low = np.arange(data_serier.shape[0])[rule[0]]
    outliers = data_serier.iloc[index_low]
    print("Description of data less than the lower bound is:")
    print(pd.Series(outliers).describe())
    index_up = np.arange(data_serier.shape[0])[rule[1]]
    outliers = data_serier.iloc[index_up]
    print("Description of data larger than the upper bound is:")
    print(pd.Series(outliers).describe())

    fig, ax = plt.subplots(1,2, figsize=(10,7))
    sns.boxplot(y=data[col_name],data=data,palette="Set1",ax=ax[0])
    sns.boxplot(y=data_n[col_name],data=data_n,palette="Set1",ax=ax[1])
    return data_n
栗子:
data = outliers_proc(data,'建築面積/呎價',scale=3)
输出:
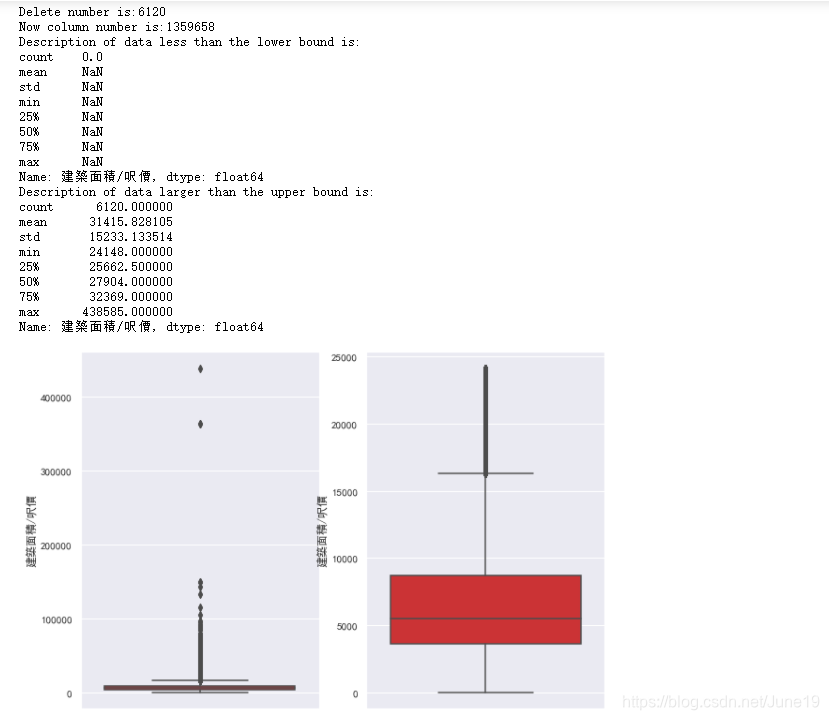
#左边的箱线图:去除异常值之前
右边的箱线图:去除异常值之后
Reference:
Datawhale 零基础入门数据挖掘-Task3 特征工程-天池实验室-实时在线的数据分析协作工具,享受免费计算资源