实验6 基本数据管理(三)
实验目的:综合应用数据框的多种操作,进行综合实验;掌握小提琴图的绘制方法。
实验内容:
1.计算2的1-50次方,以及1-50的平方,找出这两个序列有哪些元素是相等的,显示出来。
x<-NULL
y<-NULL
for(i in 1:50){
  tmp1<-2^i
  tmp2<-i^2
  x=c(x,tmp1)
  y=c(y,tmp2)
}
z=NULL
for(i in 1:50)
  for(j in 1:50)
    if(x[i]==y[j])
      z=c(z,x[i])
print(z)

2.请问1:9*1:4的结果是什么?实验给出结果,并解释求解过程。
> 1:9*1:4
[1]  1  4  9 16  5 12 21 32  9
Warning message:
In 1:9 * 1:4 :
  longer object length is not a multiple of shorter object length

因为两个向量的长度不同,会按照广播原则将第二个向量扩展为 1 2 3 4 1 2 3 4 1,然后再进行运算。
3.定义字符串data为“R语言是一门艺术”,data1为“用心去体会”,将两字符串进行连接,并用冒号分隔。统计连接后字符串的长度 。
> data<-"R语言是一门艺术"
> data1<-"用心去体会"
> data2<-paste(data,data1,sep = ":")
> data2
[1] "R语言是一门艺术:用心去体会"
> nchar(data2)
[1] 14

4.序列生成
a) 生成具有100个元素的向量e,每个元素服从[-3,3]之间均匀分布的随机数。
b) 使用y=3.14*x^2+log(x)+e生成序列y, x属于[1,100],将y保存至d.csv.
> e<-runif(100,-3,3)
> x<-runif(100,1,100)
> y<-3.14*x^2+log(x)+e
> write(y,"E:/R语言/作业/d.csv")

5.请生成如下所示的数据框

1.) 运单编号以334开头,后面的6位数字随机生成,得到运单编号字符串
2.) 寄件日期生成随机时间序列,可以使用as.Date()函数
3.) 目的地首先生成4个数字向量,之后重编码为字符串(晋 冀 鲁 豫)
4.) 计费重量随机生成1-100之间的小数,保留2位
5.) 应收运费计算方法为:1公斤以内,收费15元,超过1公斤,超出部分,每公斤收3元
6.) 生成20条运单记录(给出的数据仅供参考)
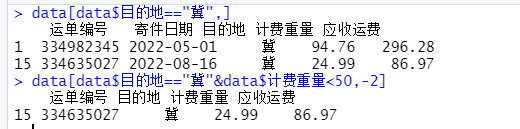
7.) 从快递账单表中抽取目的地为“冀”的信息
8.) 从快递账单表中抽取目的地为“冀”并且计费重量<50的信息,不显示寄件日期
> no<-paste('334',trunc(runif(20,100000,999999)),sep = '')
> no
[1] "334875326" "334137817" "334879106" "334604430" "334142065" "334954431" "334640708" "334437793"
[9] "334615978" "334241614" "334664171" "334375283" "334874542" "334930917" "334495717" "334730331"
[17] "334203390" "334682227" "334974901" "334340394"
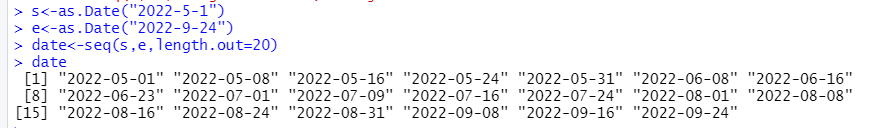
> s<-as.Date("2022-5-1")
> e<-as.Date("2022-9-24")
> date<-seq(s,e,length.out=20)
> date
[1] "2022-05-01" "2022-05-08" "2022-05-16" "2022-05-24" "2022-05-31" "2022-06-08" "2022-06-16"
[8] "2022-06-23" "2022-07-01" "2022-07-09" "2022-07-16" "2022-07-24" "2022-08-01" "2022-08-08"
[15] "2022-08-16" "2022-08-24" "2022-08-31" "2022-09-08" "2022-09-16" "2022-09-24"
> x<-trunc(runif(20,1,5))
> x
[1] 2 1 4 1 1 3 3 1 4 3 1 1 3 4 2 3 1 3 4 1
> place<-ifelse(x==1,"晋",ifelse(x==2,"冀",ifelse(x==3,"鲁","豫")))
> place
[1] "冀" "晋" "豫" "晋" "晋" "鲁" "鲁" "晋" "豫" "鲁" "晋" "晋" "鲁" "豫" "冀" "鲁" "晋" "鲁" "豫"
[20] "晋"
> weight<-round(runif(20,1,100),2)
> weight
[1] 94.76 40.42 8.99 9.86 76.51 25.92 45.22 20.71 43.74 82.28 93.59 82.35 67.96 63.04 24.99 3.33
[17] 76.81 70.66 56.09 98.85
> cost<-ifelse(weight<1,15,15+(weight-1)*3)
> cost
[1] 296.28 133.26 38.97 41.58 241.53 89.76 147.66 74.13 143.22 258.84 292.77 259.05 215.88
[14] 201.12 86.97 21.99 242.43 223.98 180.27 308.55
> data<-data.frame(no,date,place,weight,cost)
> names(data)<-c("运单编号","寄件日期","目的地","计费重量","应收运费")
> data
运单编号 寄件日期 目的地 计费重量 应收运费
1 334982345 2022-05-01 冀 94.76 296.28
2 334496983 2022-05-08 晋 40.42 133.26
3 334409416 2022-05-16 豫 8.99 38.97
4 334968837 2022-05-24 晋 9.86 41.58
5 334750787 2022-05-31 晋 76.51 241.53
6 334972923 2022-06-08 鲁 25.92 89.76
7 334990372 2022-06-16 鲁 45.22 147.66
8 334970233 2022-06-23 晋 20.71 74.13
9 334957906 2022-07-01 豫 43.74 143.22
10 334464116 2022-07-09 鲁 82.28 258.84
11 334277235 2022-07-16 晋 93.59 292.77
12 334721102 2022-07-24 晋 82.35 259.05
13 334806711 2022-08-01 鲁 67.96 215.88
14 334455177 2022-08-08 豫 63.04 201.12
15 334635027 2022-08-16 冀 24.99 86.97
16 334606335 2022-08-24 鲁 3.33 21.99
17 334468092 2022-08-31 晋 76.81 242.43
18 334503952 2022-09-08 鲁 70.66 223.98
19 334349809 2022-09-16 豫 56.09 180.27
20 334461045 2022-09-24 晋 98.85 308.55
> data[data$目的地=="冀",]
运单编号 寄件日期 目的地 计费重量 应收运费
1 334982345 2022-05-01 冀 94.76 296.28
15 334635027 2022-08-16 冀 24.99 86.97
> data[data$目的地=="冀"&data$计费重量<50,-2]
运单编号 目的地 计费重量 应收运费
15 334635027 冀 24.99 86.97


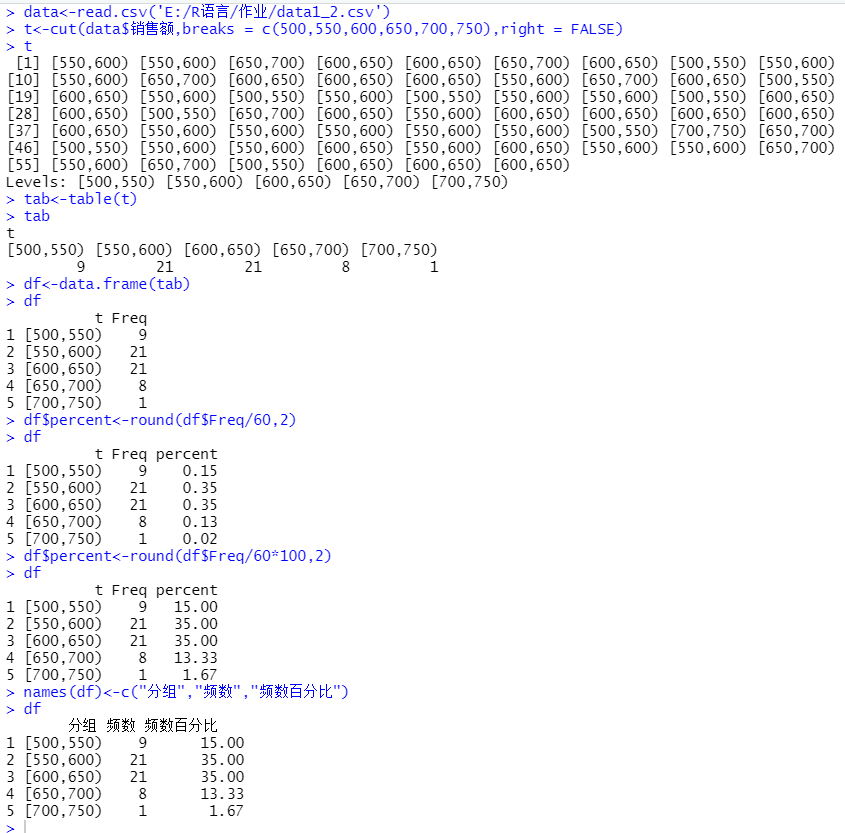
6.数据data1_2.csv是一家购物网站连续60天的销售额数据。生成一张频数分布表,并计算各组频数的百分比。
实验结果如下所示:
|
分组 |
频数 |
频数百分比 |
| 1 |
[500,550 |
9 |
15.00 |
| 2 |
[550,600 |
21 |
35.00 |
| 3 |
[600,650 |
21 |
35.00 |
| 4 |
[650,700 |
8 |
13.33 |
| 5 |
[700,750 |
1 |
1.67 |
实验步骤:
- 使用cut函数生成频数分布表
- 组织成数据框
- 计算频数百分比,结果保留2位小数
- 将频数百分比添加到数据框
- 为数据框的各个成员重命名为“分组,频数,频数百分比”
- 显示频数分布表
> data<-read.csv('E:/R语言/作业/data1_2.csv')
> t<-cut(data$销售额,breaks = c(500,550,600,650,700,750),right = FALSE)
> t
 [1] [550,600) [550,600) [650,700) [600,650) [600,650) [650,700) [600,650) [500,550) [550,600)
[10] [550,600) [650,700) [600,650) [600,650) [600,650) [550,600) [650,700) [600,650) [500,550)
[19] [600,650) [550,600) [500,550) [550,600) [500,550) [550,600) [550,600) [500,550) [600,650)
[28] [600,650) [500,550) [650,700) [600,650) [550,600) [600,650) [600,650) [600,650) [600,650)
[37] [600,650) [550,600) [550,600) [550,600) [550,600) [550,600) [500,550) [700,750) [650,700)
[46] [500,550) [550,600) [550,600) [600,650) [550,600) [600,650) [550,600) [550,600) [650,700)
[55] [550,600) [650,700) [500,550) [600,650) [600,650) [600,650)
Levels: [500,550) [550,600) [600,650) [650,700) [700,750)
> tab<-table(t)
> tab
t
[500,550) [550,600) [600,650) [650,700) [700,750)
        9        21        21         8         1
> df<-data.frame(tab)
> df
          t Freq
1 [500,550)    9
2 [550,600)   21
3 [600,650)   21
4 [650,700)    8
5 [700,750)    1

> df$percent<-round(df$Freq/60*100,2)
> df
          t Freq percent
1 [500,550)    9   15.00
2 [550,600)   21   35.00
3 [600,650)   21   35.00
4 [650,700)    8   13.33
5 [700,750)    1    1.67
> names(df)<-c("分组","频数","频数百分比")
> df
       分组 频数 频数百分比
1 [500,550)    9      15.00
2 [550,600)   21      35.00
3 [600,650)   21      35.00
4 [650,700)    8      13.33
5 [700,750)    1       1.67
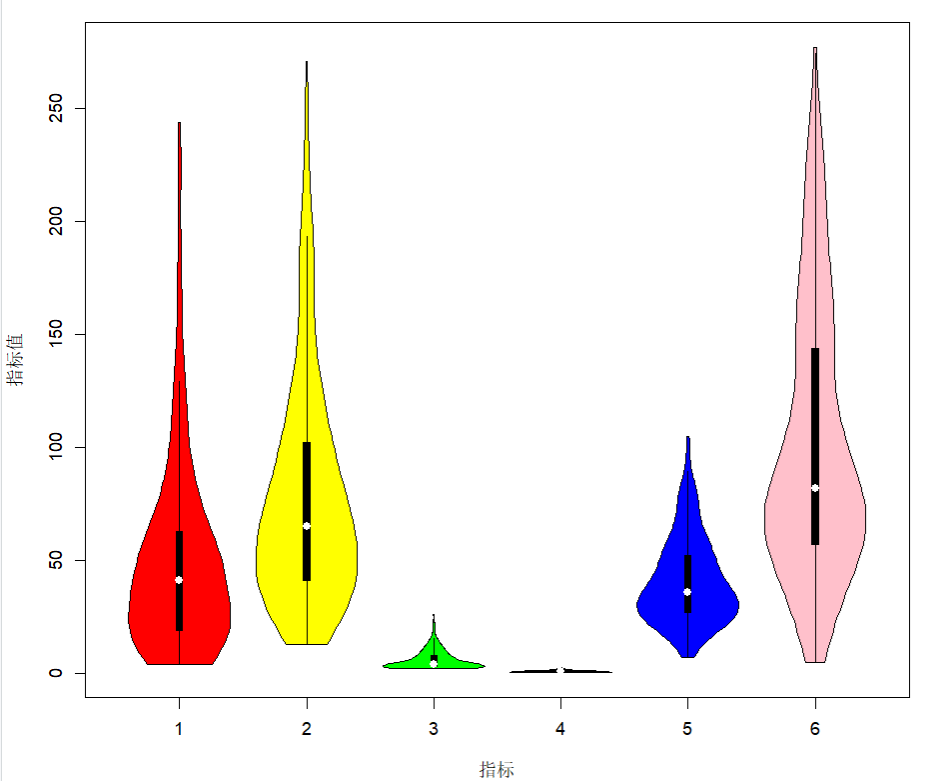
7.调用vioplot包中的vioplot函数绘制如下图所示的data4_1的6项空气污染指标的小提琴图。

> install.packages('vioplot')#下载vioplot包
> library(sm)
> library(zoo)
> library(vioplot)
> data<-read.csv('E:/R语言/作业/data4_1.csv')
> vioplot(data[,4:9],col = c("red","yellow","green","black","blue","pink"))
> title(ylab = "指标值",xlab = "指标")


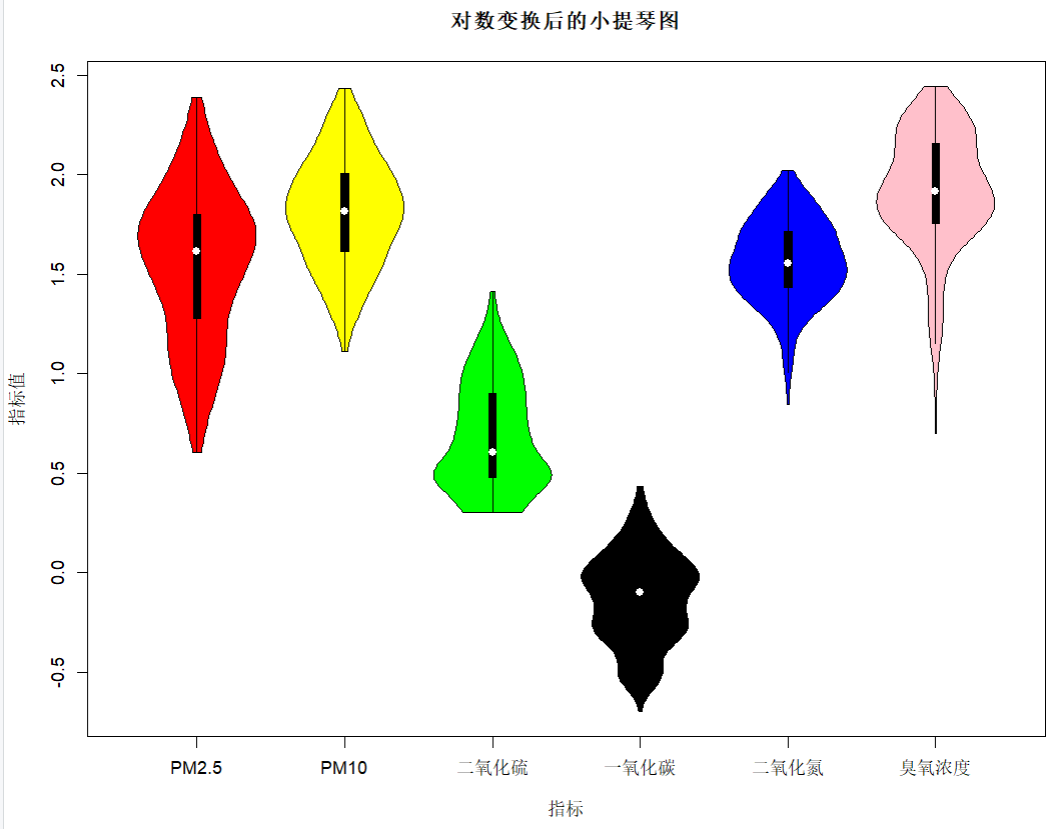
8.对题7数据进行以10为底的对数变换后,绘制小提琴图
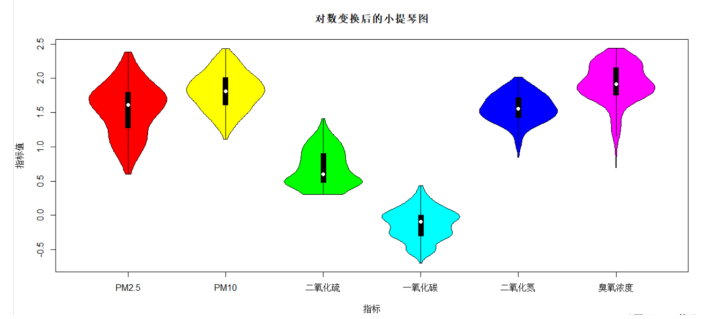
> x<-log10(data[,4:9])
> vioplot(x,names = c("PM2.5","PM10","二氧化硫","一氧化碳","二氧化氮","臭氧浓度"),col = c("red","yellow","green","black","blue","pink"))
> title("对数变换后的小提琴图",ylab = "指标值",xlab = "指标")

- 题7数据进行标准化变换后,绘制小提琴图

> x<-scale(data[,4:9])
> vioplot(x,names = c("PM2.5","PM10","二氧化硫","一氧化碳","二氧化氮","臭氧浓度"),col = c("red","yellow","green","black","blue","pink"))
> title("标准化变换后的小提琴图",ylab = "指标值",xlab = "指标")

