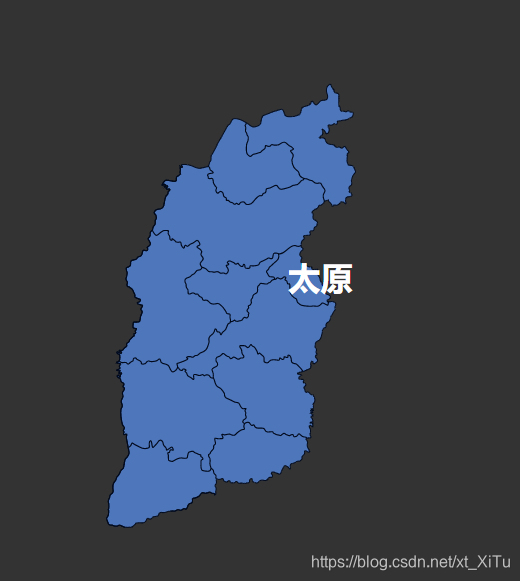
首先在页面中放上地图图片,并建立三个canvas标签,分别用于点、迁徙线、动态效果
   <div class="mapBox">
      <div class="map">
        <img src="@/assets/shanxi.svg" alt="">
      </div>
            <!-- 线 -->
      <canvas id="canvas" class="canvas"></canvas>
      <!-- 点 -->
      <canvas id="canvasPoint" class="canvas"></canvas>
      <!-- 动态效果 -->
      <canvas id="canvasMove" class="canvas"></canvas>
    </div>
初始化canvas
初始化时,需要给各个canvas画布一个确定的宽高,否则画布会使用固定的宽300高150,这时如果另外使用的css给canvas画布制定宽高样式,会导致画布被拉伸,里面内容也会跟着被拉伸
  data() {
    return {
      canvas: null,
      canvasPoint: null,
      canvasMove: null,
      center: {}, // 迁徙线起点位置
      directionArr: [], // 迁徙线终点位置
      endKeep: [], // 保存一下各个迁徙线起点
      end: [], // 运动中的各迁徙线时间p时所在位置
      p: 0, // 时间记录,每到1时变为0
      step: 0.005, // 时间每次递增量
      animationSpeed: 0.03, // 点动画效果圆圈每次增加量
      dotNumber: 25, // 动画迁徙线 动态的线的部分由多少个点组成
      rate: 1.053, // 1.033 贝塞尔曲线计算时用到的参数
      requestAnimationFrameName: '',
      compareData: [ // 用于临时计算各终点位置的参数
        { x: 0.65, y: 0.89 },
        { x: 0.094, y: 0.76 },
        { x: 0.95, y: 0.28 },
        { x: 0.19, y: 0.19 },
        { x: 0.49, y: 0.08 }
      ]
    };
  },
  mounted() {
    this.init();
  },
  methods: {
    init() {
      // 获取需要画布达到的宽高数据
      const mapBox = document.getElementsByClassName('mapBox')[0];
      const width = mapBox.offsetWidth;
      const height = mapBox.offsetHeight;
      // 拿到三个画布,给定宽高
      const canvas = document.getElementById('canvas');
      const canvasPoint = document.getElementById('canvasPoint');
      const canvasMove = document.getElementById('canvasMove');
      canvas.width = width;
      canvas.height = height;
      canvasPoint.width = width;
      canvasPoint.height = height;
      canvasMove.width = width;
      canvasMove.height = height;
      this.canvas = canvas.getContext('2d');
      this.canvasPoint = canvasPoint.getContext('2d');
      this.canvasMove = canvasMove.getContext('2d');
      // 找到所有迁徙线起点,项目中我的起点是太原,所以大概找到一下
      this.center = {
        x: Math.ceil(width * 0.52),
        y: Math.ceil(height * 0.48)
      };
      // 各线终点 以下仅为参考,具体以项目要求为准
      for (let i = 0; i<= 4; i++) {
        this.directionArr[i] = {
          x: Math.ceil(width * compareData[index].x),
          y: Math.ceil(height * compareData[index].y)
        }
        this.endKeep[index] = {
          x: this.center.x,
          y: this.center.y
        };
      }
      this.end = JSON.parse(JSON.stringify(this.endKeep));
    },
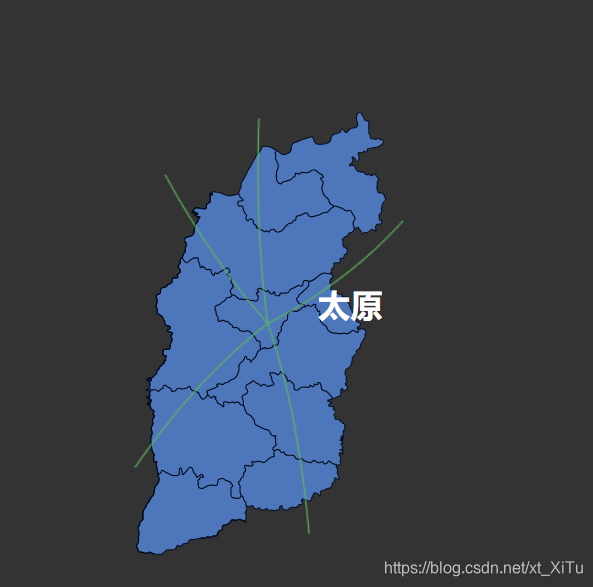
画布一:固定的迁徙线画布
drawAllLine() {
  // 根据每个点分别画线
  this.directionArr.forEach(item => {
    this.drawLine(item);
  });
},
drawLine({ x, y }) {
      this.canvas.beginPath();
      this.canvas.moveTo(this.center.x, this.center.y); // 起始点(x,y)
      // 计算贝塞尔曲线控制点位置
      const coord = this.calcCp([x, y], [this.center.x, this.center.y]);
      this.canvas.quadraticCurveTo(coord.x, coord.y, x, y); //创建二次贝塞尔曲线
      // 线宽1
      this.canvas.lineWidth = 1;
      // 线颜色
      this.canvas.strokeStyle = '#5cb85c';
      this.canvas.stroke();
      this.canvas.closePath();
},
/*
 * num: 要被转换的数字
 * exnum: 当前中心坐标 不一定是x还是y
 */
calcCp(start, end) {
  let middleX = 0;
  let middleY = 0;
  if (start[0] > end[0] && start[1] > end[1]) {
    middleX = ((start[0] + end[0]) / 2) * this.rate;
    middleY = ((start[1] + end[1]) / 2) * (2 - this.rate);
  }
  if (start[0] > end[0] && start[1] < end[1]) {
    middleX = ((start[0] + end[0]) / 2) * this.rate;
    middleY = ((start[1] + end[1]) / 2) * this.rate;
  }
  if (start[0] < end[0] && start[1] > end[1]) {
    middleX = ((start[0] + end[0]) / 2) * (2 - this.rate);
    middleY = ((start[1] + end[1]) / 2) * (2 - this.rate);
  }
  if (start[0] < end[0] && start[1] < end[1]) {
    middleX = ((start[0] + end[0]) / 2) * (2 - this.rate);
    middleY = ((start[1] + end[1]) / 2) * this.rate;
  }
  return {
    x: middleX,
    y: middleY
  };
},
画布二:各终点效果
data中增加关于点的一些参数
      radius: 1, // 航路点半径
      radiusRing: 1,
      radiusRingMin: 1,
      radiusRingMax: 25, // 最大设为25时,涟漪消失的不会很突兀
      dotColor: '243,254,193',
      ringColor: 'rgba(236,210,32,0.5)'
还需要增加控制动画执行的方法
    drawPoint(x1, y1) {
      // 最里圈小圆
      this.canvasPoint.fillStyle = `rgba(${this.dotColor}, 1)`;
      this.canvasPoint.beginPath();
      this.canvasPoint.arc(x1, y1, this.radius, 0, 2 * Math.PI);
      this.canvasPoint.closePath();
      this.canvasPoint.fill();

      // 外层小圆
      this.canvasPoint.fillStyle = `rgba(${this.dotColor}, 0.3)`;
      this.canvasPoint.beginPath();
      this.canvasPoint.arc(x1, y1, this.accAdd(this.radius, 3), 0, 2 * Math.PI);
      this.canvasPoint.closePath();
      this.canvasPoint.fill();

      // 以下为涟漪部分
      if (this.radiusRing >= this.radiusRingMax) {
        this.radiusRing = this.radiusRingMin;
      }
      this.canvasPoint.fillStyle = this.ringColor;
      this.canvasPoint.beginPath();
      this.canvasPoint.arc(x1, y1, this.radiusRing, 0, 2 * Math.PI);
      this.canvasPoint.closePath();
      this.canvasPoint.fill();
      // this.radiusRing += 0.03;
      this.radiusRing += this.animationSpeed;
      this.ringColor =
        this.ringColor
          .split(',')
          .slice(0, 3)
          .join(',') +
        ',' +
        (0.5 - (this.radiusRing - this.radiusRingMin) * 0.02) +
        ')';
    },
    drawMove() {
      cancelAnimationFrame(this.requestAnimationFrameName);
      // 动态线的画布
      // 点的画布
      this.canvasPoint.clearRect(0, 0, 10000, 10000);
      this.drawPoint(this.center.x, this.center.y);
      this.directionArr.forEach((item) => {
        this.drawPoint(item.x, item.y);
      });
      this.p = this.accAdd(this.p, this.step);
      this.requestAnimationFrameName = requestAnimationFrame(this.drawMove);
    },
画布三:奔跑的动态线条以及小飞机
此处需要增加一个img标签,放上小飞机图标
目前依然存在飞机图标飞行角度不准确问题,以后有时间再调整
js代码如下
  mounted() {
    this.plane = document.getElementById('airportIcon');
    this.init();
  },
  drawMivie(index) {
      // 获取当前时间p时贝塞尔曲线的x, y点
      const coord = this.calcCp(
        [this.directionArr[index].x, this.directionArr[index].y],
        [this.center.x, this.center.y]
      );
      const x = this.calcRightNow(this.p, this.center.x, coord.x, this.directionArr[index].x);
      const y = this.calcRightNow(this.p, this.center.y, coord.y, this.directionArr[index].y);
      this.canvasMove.beginPath();
      this.canvasMove.moveTo(this.end[index].x, this.end[index].y);
      this.canvasMove.lineTo(x, y);
      const gnt1 = this.canvasMove.createLinearGradient(this.end[index].x, this.end[index].y, x, y);
      gnt1.addColorStop(0, '#fff');
      gnt1.addColorStop(1, '#ECD220');
      this.canvasMove.strokeStyle = gnt1;
      this.canvasMove.lineWidth = 1;
      this.canvasMove.stroke();
      // this.canvasMove.closePath();
      for (var i = 0; i < this.dotNumber; i++) {
        let _t = this.p - this.step * i * 2 >= 0 ? this.p - this.step * i * 2 : 1 + (this.p - this.step * i * 2);
        const coord1 = this.calcCp(
          [this.directionArr[index].x, this.directionArr[index].y],
          [this.center.x, this.center.y]
        );
        const x1 = this.calcRightNow(_t, this.center.x, coord1.x, this.directionArr[index].x);
        const y1 = this.calcRightNow(_t, this.center.y, coord1.y, this.directionArr[index].y);
        this.canvasMove.fillStyle = 'rgba(' + this.dotColor + ',' + (1 - (1 / this.dotNumber) * i) + ')';
        this.canvasMove.beginPath();
        this.canvasMove.arc(x1, y1, 1, 0, 2 * Math.PI);
        this.canvasMove.fill();
        this.canvasMove.closePath();
      }
      // 加个小飞机图标飞起来
      const xx = this.calcRightNow(this.p + this.step * 3, this.center.x, coord.x, this.directionArr[index].x);
      const yy = this.calcRightNow(this.p + this.step * 2, this.center.y, coord.y, this.directionArr[index].y);
      const img = this.createIcon(xx, yy, index);
      this.canvasMove.drawImage(img, xx - 8, yy - 8);
      this.end[index].x = x;
      this.end[index].y = y;
    },
    // 获取当前时间p时贝塞尔曲线的x, y点, 此方法不区分x y
    calcRightNow(p, start, controlPoint, end) {
      return Math.pow(1 - p, 2) * start + 2 * p * (1 - p) * controlPoint + Math.pow(p, 2) * end;
    },
    getAngle(x, y) {
      var radian = Math.atan(y / x); // 弧度
      var angle = Math.floor(180 / (Math.PI / radian)); // 弧度转角度
      if (x < 0) {
        // x小于0的时候加上180°,即实际角度
        angle = angle + 180;
      }
      return angle;
    },
    createIcon(x, y, index) {
      const deg = this.getAngle(x - this.end[index].x, y - this.end[index].y);
      const c = document.createElement('canvas');
      c.width = 16;
      c.height = 16;
      const cCtx = c.getContext('2d');
      cCtx.translate(8, 8);
      if (y < this.end[index].y && ((Math.abs(deg) > 80 && Math.abs(deg) < 91) || (deg > 240 && deg < 270))) {
        cCtx.drawImage(this.plane, -8, -8);
      } else if (x >= this.end[index].x && y < this.end[index].y) {
        cCtx.rotate(((-deg + 20) * Math.PI) / 180);
        cCtx.drawImage(this.plane, -8, -8);
        cCtx.rotate(((deg - 20) * Math.PI) / 180);
      } else if (x < this.end[index].x && y < this.end[index].y) {
        cCtx.rotate(((-deg + 160) * Math.PI) / 180);
        cCtx.drawImage(this.plane, -8, -8);
        cCtx.rotate(((deg - 160) * Math.PI) / 180);
      } else if (x < this.end[index].x && y >= this.end[index].y) {
        cCtx.rotate(((-deg + 45) * Math.PI) / 180);
        cCtx.drawImage(this.plane, -8, -8);
        cCtx.rotate(((deg - 45) * Math.PI) / 180);
      } else {
        cCtx.rotate(((225 - deg) * Math.PI) / 180);
        cCtx.drawImage(this.plane, -8, -8);
        cCtx.rotate(((deg - 225) * Math.PI) / 180);
      }
      return c;
    },
    drawMove() {
      cancelAnimationFrame(this.requestAnimationFrameName);
      // 动态线的画布
      this.canvasMove.clearRect(0, 0, 10000, 10000);
      if (this.p >= 1) {
        this.p = this.step;
        this.end = JSON.parse(JSON.stringify(this.endKeep));
      }
      // 点的画布
      this.canvasPoint.clearRect(0, 0, 10000, 10000);
      this.drawPoint(this.center.x, this.center.y);
      this.directionArr.forEach((item, index) => {
        this.drawMivie(index);
        this.drawPoint(item.x, item.y);
      });
      this.p = this.accAdd(this.p, this.step);
      this.requestAnimationFrameName = requestAnimationFrame(this.drawMove);
    },
以下为完整代码
<template>
  <div class="box">
    <div class="mapBox">
      <div class="map">
        <img src="@/assets/shanxi.svg" alt="">
      </div>
      <!-- 线 -->
      <canvas id="canvas" class="canvas"></canvas>
      <!-- 点 -->
      <canvas id="canvasPoint" class="canvas"></canvas>
      <!-- 动态效果 -->
      <canvas id="canvasMove" class="canvas"></canvas>
      <img class="airport" id="airportIcon" src="@/assets/airport.svg" alt="">
    </div>
  </div>
</template>

<script>
export default {
  name: 'homePage',
  data() {
    return {
      canvas: null,
      canvasPoint: null,
      canvasMove: null,
      center: {}, // 迁徙线起点位置
      directionArr: [], // 迁徙线终点位置
      endKeep: [], // 保存一下各个迁徙线起点
      end: [], // 运动中的各迁徙线时间p时所在位置
      p: 0, // 时间记录,每到1时变为0
      step: 0.005, // 时间每次递增量
      animationSpeed: 0.03, // 点动画效果圆圈每次增加量
      dotNumber: 25, // 动画迁徙线 动态的线的部分由多少个点组成
      rate: 1.053, // 1.033 贝塞尔曲线计算时用到的参数
      requestAnimationFrameName: '',
      compareData: [ // 用于临时计算各终点位置的参数
        { x: 0.65, y: 0.89 },
        { x: 0.094, y: 0.76 },
        { x: 0.95, y: 0.28 },
        { x: 0.19, y: 0.19 },
        { x: 0.49, y: 0.08 }
      ],
      radius: 1, // 航路点半径
      radiusRing: 1,
      radiusRingMin: 1,
      radiusRingMax: 25, // 最大设为25时,涟漪消失的不会很突兀
      dotColor: '243,254,193',
      ringColor: 'rgba(236,210,32,0.5)',
      plane: null
    };
  },
  mounted() {
    this.plane = document.getElementById('airportIcon');
    this.init();
  },
  methods: {
    init() {
      // 获取需要画布达到的宽高数据
      const mapBox = document.getElementsByClassName('mapBox')[0];
      const width = mapBox.offsetWidth;
      const height = mapBox.offsetHeight;
      // 拿到三个画布,给定宽高
      const canvas = document.getElementById('canvas');
      const canvasPoint = document.getElementById('canvasPoint');
      const canvasMove = document.getElementById('canvasMove');
      canvas.width = width;
      canvas.height = height;
      canvasPoint.width = width;
      canvasPoint.height = height;
      canvasMove.width = width;
      canvasMove.height = height;
      this.canvas = canvas.getContext('2d');
      this.canvasPoint = canvasPoint.getContext('2d');
      this.canvasMove = canvasMove.getContext('2d');
      // 找到所有迁徙线起点,项目中我的起点是太原,所以大概找到一下
      this.center = {
        x: Math.ceil(width * 0.52),
        y: Math.ceil(height * 0.48)
      };
      // 各线终点 以下仅为参考,具体以项目要求为准
      for (let i = 0; i <= 4; i++) {
        this.directionArr[i] = {
          x: Math.ceil(width * this.compareData[i].x),
          y: Math.ceil(height * this.compareData[i].y)
        }
        this.endKeep[i] = {
          x: this.center.x,
          y: this.center.y
        };
      }
      this.end = JSON.parse(JSON.stringify(this.endKeep));
      // 画线开始
      this.drawAllLine();
    },
    drawAllLine() {
      // 根据每个点分别画线
      this.directionArr.forEach(item => {
        this.drawLine(item);
      });
      this.drawMove();
    },
    drawLine({ x, y }) {
      this.canvas.beginPath();
      this.canvas.moveTo(this.center.x, this.center.y); // 起始点(x,y)
      // 计算贝塞尔曲线控制点位置
      const coord = this.calcCp([x, y], [this.center.x, this.center.y]);
      this.canvas.quadraticCurveTo(coord.x, coord.y, x, y); //创建二次贝塞尔曲线
      // 线宽1
      this.canvas.lineWidth = 1;
      // 线颜色
      this.canvas.strokeStyle = '#5cb85c';
      this.canvas.stroke();
      this.canvas.closePath();
    },
    drawPoint(x1, y1) {
      // 最里圈小圆
      this.canvasPoint.fillStyle = `rgba(${this.dotColor}, 1)`;
      this.canvasPoint.beginPath();
      this.canvasPoint.arc(x1, y1, this.radius, 0, 2 * Math.PI);
      this.canvasPoint.closePath();
      this.canvasPoint.fill();

      // 外层小圆
      this.canvasPoint.fillStyle = `rgba(${this.dotColor}, 0.3)`;
      this.canvasPoint.beginPath();
      this.canvasPoint.arc(x1, y1, this.accAdd(this.radius, 3), 0, 2 * Math.PI);
      this.canvasPoint.closePath();
      this.canvasPoint.fill();

      // 以下为涟漪部分
      if (this.radiusRing >= this.radiusRingMax) {
        this.radiusRing = this.radiusRingMin;
      }
      this.canvasPoint.fillStyle = this.ringColor;
      this.canvasPoint.beginPath();
      this.canvasPoint.arc(x1, y1, this.radiusRing, 0, 2 * Math.PI);
      this.canvasPoint.closePath();
      this.canvasPoint.fill();
      // this.radiusRing += 0.03;
      this.radiusRing += this.animationSpeed;
      this.ringColor =
        this.ringColor
          .split(',')
          .slice(0, 3)
          .join(',') +
        ',' +
        (0.5 - (this.radiusRing - this.radiusRingMin) * 0.02) +
        ')';
    },
    drawMivie(index) {
      // 获取当前时间p时贝塞尔曲线的x, y点
      const coord = this.calcCp(
        [this.directionArr[index].x, this.directionArr[index].y],
        [this.center.x, this.center.y]
      );
      const x = this.calcRightNow(this.p, this.center.x, coord.x, this.directionArr[index].x);
      const y = this.calcRightNow(this.p, this.center.y, coord.y, this.directionArr[index].y);
      this.canvasMove.beginPath();
      this.canvasMove.moveTo(this.end[index].x, this.end[index].y);
      this.canvasMove.lineTo(x, y);
      const gnt1 = this.canvasMove.createLinearGradient(this.end[index].x, this.end[index].y, x, y);
      gnt1.addColorStop(0, '#fff');
      gnt1.addColorStop(1, '#ECD220');
      this.canvasMove.strokeStyle = gnt1;
      this.canvasMove.lineWidth = 1;
      this.canvasMove.stroke();
      // this.canvasMove.closePath();
      for (var i = 0; i < this.dotNumber; i++) {
        let _t = this.p - this.step * i * 2 >= 0 ? this.p - this.step * i * 2 : 1 + (this.p - this.step * i * 2);
        const coord1 = this.calcCp(
          [this.directionArr[index].x, this.directionArr[index].y],
          [this.center.x, this.center.y]
        );
        const x1 = this.calcRightNow(_t, this.center.x, coord1.x, this.directionArr[index].x);
        const y1 = this.calcRightNow(_t, this.center.y, coord1.y, this.directionArr[index].y);
        this.canvasMove.fillStyle = 'rgba(' + this.dotColor + ',' + (1 - (1 / this.dotNumber) * i) + ')';
        this.canvasMove.beginPath();
        this.canvasMove.arc(x1, y1, 1, 0, 2 * Math.PI);
        this.canvasMove.fill();
        this.canvasMove.closePath();
      }
      // 加个小飞机图标飞起来
      const xx = this.calcRightNow(this.p + this.step * 3, this.center.x, coord.x, this.directionArr[index].x);
      const yy = this.calcRightNow(this.p + this.step * 2, this.center.y, coord.y, this.directionArr[index].y);
      const img = this.createIcon(xx, yy, index);
      this.canvasMove.drawImage(img, xx - 8, yy - 8);
      this.end[index].x = x;
      this.end[index].y = y;
    },
    // 获取当前时间p时贝塞尔曲线的x, y点, 此方法不区分x y
    calcRightNow(p, start, controlPoint, end) {
      return Math.pow(1 - p, 2) * start + 2 * p * (1 - p) * controlPoint + Math.pow(p, 2) * end;
    },
    getAngle(x, y) {
      var radian = Math.atan(y / x); // 弧度
      var angle = Math.floor(180 / (Math.PI / radian)); // 弧度转角度
      if (x < 0) {
        // x小于0的时候加上180°,即实际角度
        angle = angle + 180;
      }
      return angle;
    },
    createIcon(x, y, index) {
      const deg = this.getAngle(x - this.end[index].x, y - this.end[index].y);
      const c = document.createElement('canvas');
      c.width = 16;
      c.height = 16;
      const cCtx = c.getContext('2d');
      cCtx.translate(8, 8);
      if (y < this.end[index].y && ((Math.abs(deg) > 80 && Math.abs(deg) < 91) || (deg > 240 && deg < 270))) {
        cCtx.drawImage(this.plane, -8, -8);
      } else if (x >= this.end[index].x && y < this.end[index].y) {
        cCtx.rotate(((-deg + 20) * Math.PI) / 180);
        cCtx.drawImage(this.plane, -8, -8);
        cCtx.rotate(((deg - 20) * Math.PI) / 180);
      } else if (x < this.end[index].x && y < this.end[index].y) {
        cCtx.rotate(((-deg + 160) * Math.PI) / 180);
        cCtx.drawImage(this.plane, -8, -8);
        cCtx.rotate(((deg - 160) * Math.PI) / 180);
      } else if (x < this.end[index].x && y >= this.end[index].y) {
        cCtx.rotate(((-deg + 45) * Math.PI) / 180);
        cCtx.drawImage(this.plane, -8, -8);
        cCtx.rotate(((deg - 45) * Math.PI) / 180);
      } else {
        cCtx.rotate(((225 - deg) * Math.PI) / 180);
        cCtx.drawImage(this.plane, -8, -8);
        cCtx.rotate(((deg - 225) * Math.PI) / 180);
      }
      return c;
    },
    drawMove() {
      cancelAnimationFrame(this.requestAnimationFrameName);
      // 动态线的画布
      this.canvasMove.clearRect(0, 0, 10000, 10000);
      if (this.p >= 1) {
        this.p = this.step;
        this.end = JSON.parse(JSON.stringify(this.endKeep));
      }
      // 点的画布
      this.canvasPoint.clearRect(0, 0, 10000, 10000);
      this.drawPoint(this.center.x, this.center.y);
      this.directionArr.forEach((item, index) => {
        this.drawMivie(index);
        this.drawPoint(item.x, item.y);
      });
      this.p = this.accAdd(this.p, this.step);
      this.requestAnimationFrameName = requestAnimationFrame(this.drawMove);
    },
    /*
     * num: 要被转换的数字
     * exnum: 当前中心坐标 不一定是x还是y
     */
    calcCp(start, end) {
      let middleX = 0;
      let middleY = 0;
      if (start[0] > end[0] && start[1] > end[1]) {
        middleX = ((start[0] + end[0]) / 2) * this.rate;
        middleY = ((start[1] + end[1]) / 2) * (2 - this.rate);
      }
      if (start[0] > end[0] && start[1] < end[1]) {
        middleX = ((start[0] + end[0]) / 2) * this.rate;
        middleY = ((start[1] + end[1]) / 2) * this.rate;
      }
      if (start[0] < end[0] && start[1] > end[1]) {
        middleX = ((start[0] + end[0]) / 2) * (2 - this.rate);
        middleY = ((start[1] + end[1]) / 2) * (2 - this.rate);
      }
      if (start[0] < end[0] && start[1] < end[1]) {
        middleX = ((start[0] + end[0]) / 2) * (2 - this.rate);
        middleY = ((start[1] + end[1]) / 2) * this.rate;
      }
      return {
        x: middleX,
        y: middleY
      };
    },
    accAdd(arg1, arg2) {
      let r1, r2, m;
      try {
        r1 = arg1.toString().split('.')[1].length;
      } catch (e) {
        r1 = 0;
      }
      try {
        r2 = arg2.toString().split('.')[1].length;
      } catch (e) {
        r2 = 0;
      }
      m = Math.pow(10, Math.max(r1, r2));
      return (arg1 * m + arg2 * m) / m;
    },
  }
};
</script>

<style lang="scss" scoped>
.box{
  background-color: #333;
  height: 100vh;
}
.mapBox {
  margin: 100px;
  width: 250px;
  height: 410px;
  position: relative;
  display: flex;
  align-items: center;
  justify-content: center;
  .map{
    width: 200px;
    height: 360px;
    img{
      width: 100%;
      height: 100%;
    }
  }
  .canvas{
    position: absolute;
    top: 0;
    left: 0;
  }
  .airport{
    width: 16px;
    height: 16px;
    z-index: -1;
    position: absolute;
  }
}
</style>