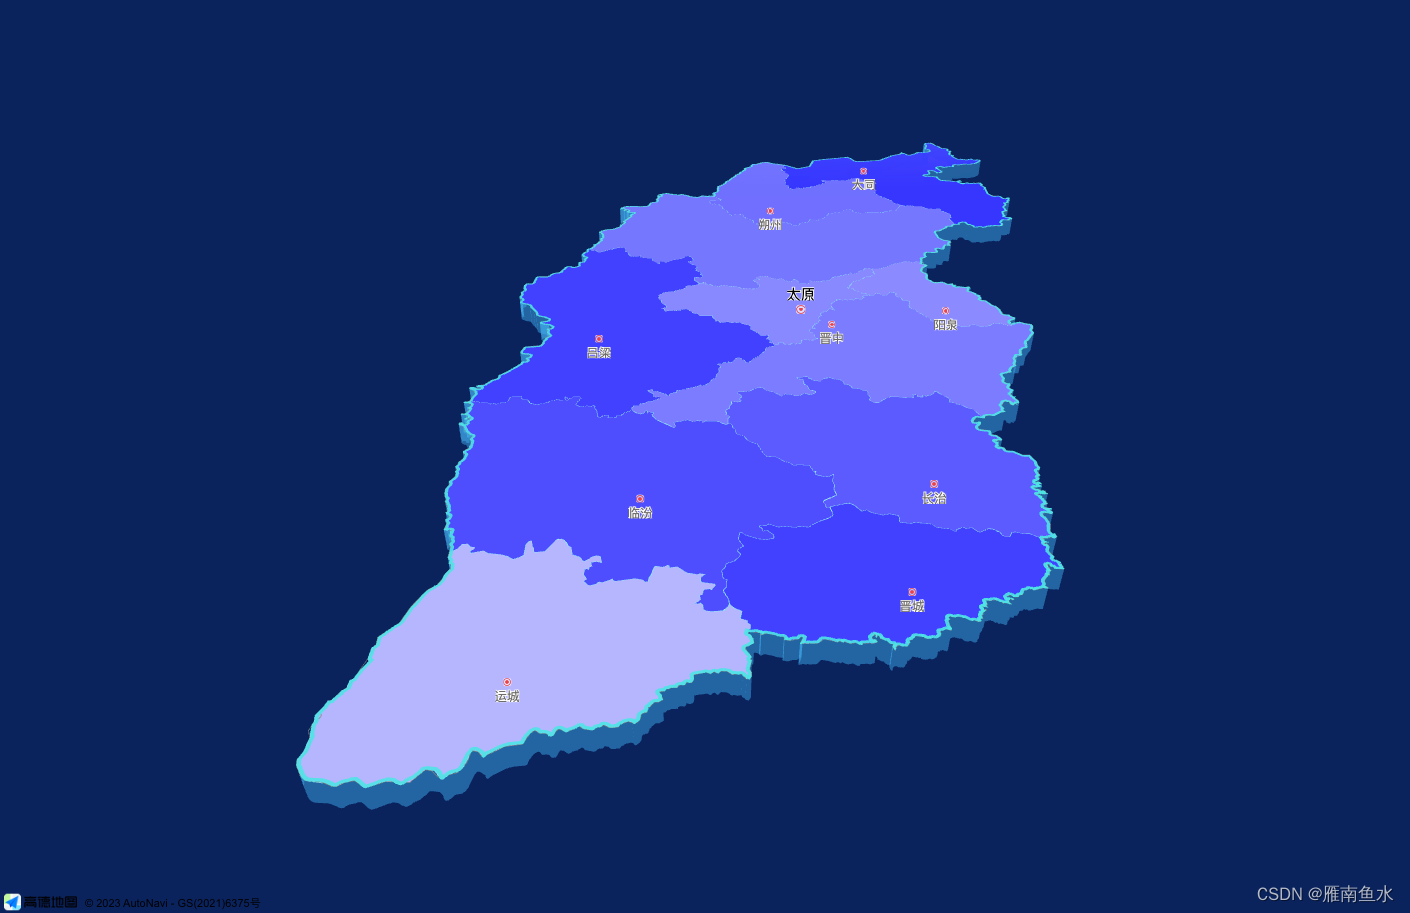
效果图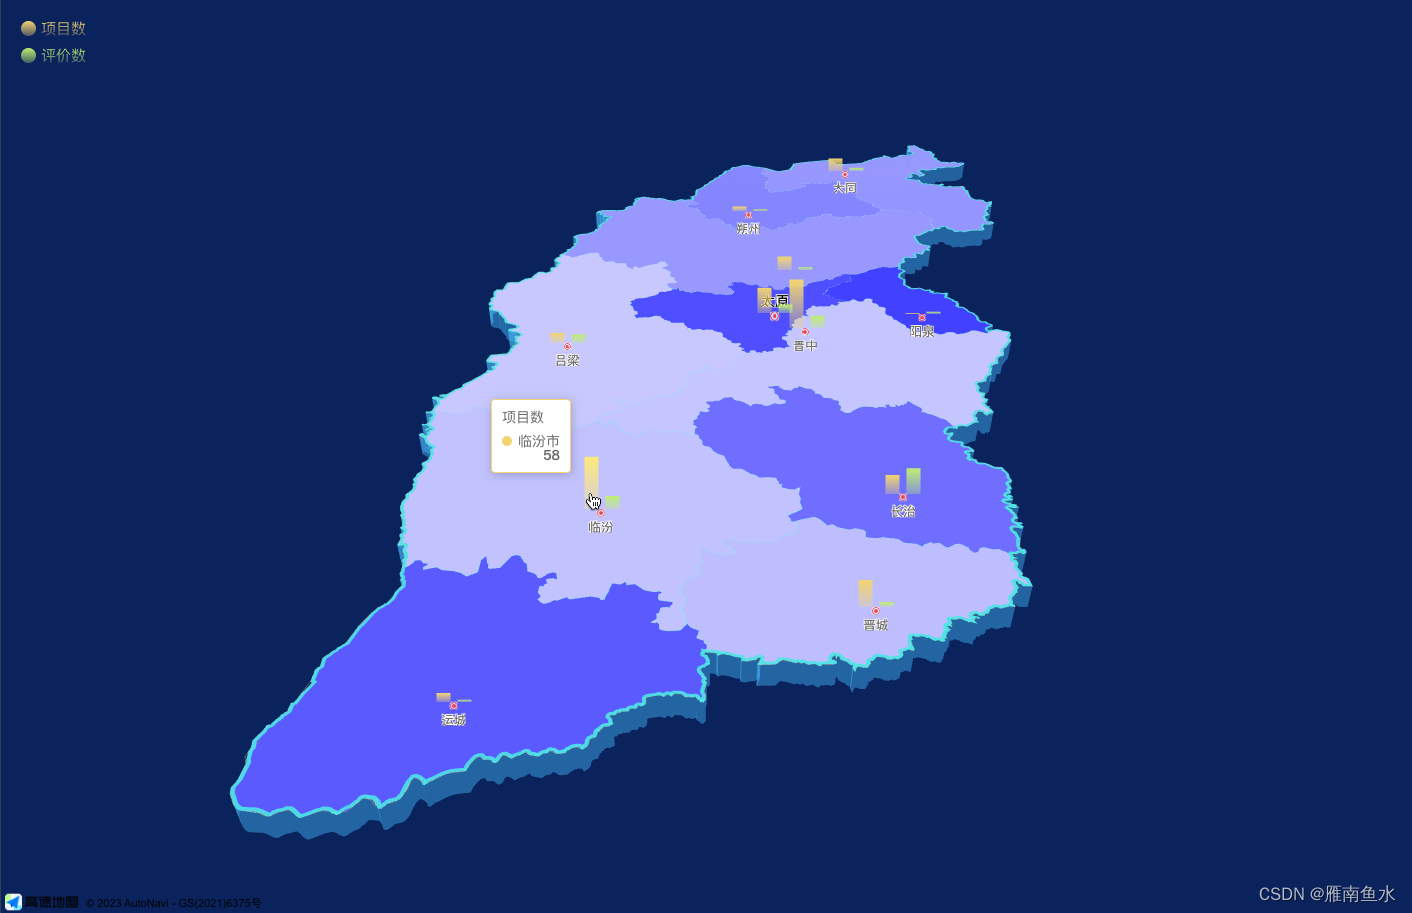
前期准备(所需依赖)
- echarts
- @amap/amap-jsapi-loader
npm i echarts @amap/amap-jsapi-loader
代码实现
3D地图
<!-- 地图容器 -->
<div id="mapContainer">

</div>
- ⚠️您在2021年12月02日以后申请的key需要配合您的安全密钥一起使用。
...
mounted() {
	this.initMap()
},
methods: {
	/**
	 * @description: 初始化地图
	 */
	initMap() {
		// TODO 之后nginx配置
		// 安全密钥使用 https://lbs.amap.com/api/javascript-api-v2/guide/abc/jscode
		// 明文方式
		window._AMapSecurityConfig = {
		  securityJsCode: '「您申请的安全密钥」'
		}

		// JS API 结合 Vue 使用
		AMapLoader.load({
		      key:"", // 申请好的Web端开发者Key,首次调用 load 时必填
		      version:"1.4.15", // 指定要加载的 JSAPI 的版本,缺省时默认为 1.4.15
		      plugins:['Map3D', 'AMap.DistrictLayer', 'AMap.DistrictSearch'], // 需要使用的的插件列表,
		      // AMap.DistrictLayer 插件只适用于版本1.4.15,所以我这边的版本选择的1.4.15
		      // 插件列表 https://lbs.amap.com/api/javascript-api/guide/abc/plugins#plugins
		    }).then((AMap)=>{
		    	const _this = this

				// 初始化地图
				this.map = new AMap.Map('mapContainer', {
					zoom: 7, // 缩放等级
					viewMode: '3D', // 默认为‘2D’,可选’3D’
					pitch: 55, // 俯仰角度,默认0,[0,83],2D地图下无效 。
					pitchEnable: true, // 是否允许设置俯仰角度,3D视图下为true,2D视图下无效。
					skyColor: 'rgba(10, 35, 93, 1)' // 天空颜色
				})

				// 3D实例
		        const object3DLayer = new AMap.Object3DLayer({ zIndex: 1 })

				// 行政区域查询实例
		        const district = new AMap.DistrictSearch({
					zIndex: 130,
					level: 'province',
					extensions: 'all',
					subdistrict: 1
		        })

				// 查询行政区域
				district.search('山西省', function(status, result) {
					if (status === 'complete') {
						// 设置地图中心
						const center = result.districtList[0].center // 中心点
						_this.map.setCenter(center)

						// 设置掩模
						const bounds = result.districtList[0].boundaries // 行政区域边界坐标连线点数组
						const mask = []
						for (let i = 0; i < bounds.length; i += 1) {
						    mask.push([bounds[i]])
						}
						_this.map.setMask(mask, mask)

						// 设置地图‘高度’
						const wall = new AMap.Object3D.Wall({
						    path: bounds,
						    height: -100000,
						    color: 'rgba(69,184,255,0.5)'
						})
						wall.backOrFront = 'both'
						wall.transparent = true
						object3DLayer.add(wall)
						_this.map.add(object3DLayer)
						// 添加描边
						for (let i = 0; i < bounds.length; i += 1) {
						    new AMap.Polyline({
						        path: bounds[i],
						        strokeColor: '#4de4e5',
						        strokeWeight: 6,
						        map: _this.map
						    })
						}

						// 设置行政区划
						_this.initDistrictLayer(AMap, 12, result.districtList[0].adcode, 1)
						_this.disProvince.setMap(_this.map)
					}
				})
		    }).catch(e=>{
		      console.log(e);
		    })
	},
	/**
     * @description: 设置市级填充颜色
     * @param {string|number} adcode 区划编码
     * @return {string} 颜色rgb
     */
	getColorByAdcode(adcode) {
		const colors = {}
		if (!colors[adcode]) {
			const gb = Math.random() * 155 + 50
			colors[adcode] = 'rgba(' + gb + ',' + gb + ',255' + ',1)'
		}
		return colors[adcode]
	},
    /**
     * @description: 初始化行政区划图层
     * @param {*} AMap AMap实例
     * @param {number} zIndex 图层叠加顺序
     * @param {string|number} adcode 区划编码
     * @param {0|1|2} depth 0:省级 1:市级 2:县级
     */
    initDistrictLayer(AMap, zIndex, adcode, depth) {
		// 行政区划
		const _this = this
		this.disProvince = new AMap.DistrictLayer.Province({
		zIndex: zIndex,
		adcode: [adcode],
		depth: depth,
		// opacity: 0,
		rejectMapMask: true,
		styles: {
			'fill': function(properties) {
				// properties为可用于做样式映射的字段,包含
				// NAME_CHN:中文名称
				// adcode_pro
				// adcode_cit
				// adcode
				const adcode = properties.adcode
				return _this.getColorByAdcode(adcode)
				},
				'stroke-width': 100,
				// 'province-stroke': 'cornflowerblue',
				'city-stroke': 'rgba(138,228,251,1)' // 中国地级市边界
				// 'county-stroke': 'rgba(255,255,255,0.5)' // 中国区县边界
			}
		})
	}
},
<style lang="scss">
.map-container {
    width: 100%;
    height: 100%;
    #mapContainer {
        width: 100%;
        height: 100%;
        background-color: transparent !important;
    }
    .amap-layer {
        background-color: rgba(10, 35, 93, 1);
    }
}
</style>
Echarts图表
我这里是通过循环创建div容器来实现每个地级市的图表展示
<template>
	...
	<div class="legend-container">
      <div class="legend-box legend-left" @click="projectShow = !projectShow">
        <div
          class="legend-icon"
          :style="{'background-image': projectShow ? 'linear-gradient(rgba(242, 212, 111, 1), rgba(242, 212, 111, 0.3))' : 'linear-gradient(rgba(75, 75, 75, 1), rgba(75, 75, 75, 1))'}"
        />
        <div class="legend-text">项目数</div>
      </div>
      <div class="legend-box" @click="discussShow = !discussShow">
        <div
          class="legend-icon"
          :style="{'background-image': discussShow ? 'linear-gradient(rgba(190, 237, 113, 1), rgba(190, 237, 113, 0.3))' : 'linear-gradient(rgba(75, 75, 75, 1), rgba(75, 75, 75, 1))'}"
        />
        <div class="legend-text">评价数</div>
      </div>
    </div>
	<div v-for="(item, index) in cityList" :key="index" style="position: absolute; z-index: 10">
      <ItemChart
        :id="index"
        ref="itemChart"
        :left="item.position.x"
        :top="item.position.y"
        :zoom="item.zoom"
        :legend-type="legendType"
        :legend-name="legendName"
        :obj-data="item.data"
        :max-y1="maxY1"
        :max-y2="maxY2"
      />
    </div>
</template>
<script>
import ItemChart from './components/ItemChart.vue'
export default{
	components: {
	    ItemChart
  	},
	data() {
		return {
			cityList: [], //图表所需要的属性
			cityDataList: [ //接口获取
	        {
	          'administrativeName': '运城市',
	          'projectNum': 10,
	          'discussNum': 5
	        },
	        {
	          'administrativeName': '大同市',
	          'projectNum': 14,
	          'discussNum': 7
	        },
	        {
	          'administrativeName': '晋中市',
	          'projectNum': 54,
	          'discussNum': 27
	        },
	        {
	          'administrativeName': '忻州市',
	          'projectNum': 15,
	          'discussNum': 6
	        },
	        {
	          'administrativeName': '临汾市',
	          'projectNum': 58,
	          'discussNum': 29
	        },
	        {
	          'administrativeName': '阳泉市',
	          'projectNum': 1,
	          'discussNum': 5
	        },
	        {
	          'administrativeName': '综改区',
	          'projectNum': 41,
	          'discussNum': 160
	        },
	        {
	          'administrativeName': '太原市',
	          'projectNum': 28,
	          'discussNum': 19
	        },
	        {
	          'administrativeName': '晋城市',
	          'projectNum': 30,
	          'discussNum': 11
	        },
	        {
	          'administrativeName': '朔州市',
	          'projectNum': 5,
	          'discussNum': 4
	        },
	        {
	          'administrativeName': '小店区',
	          'projectNum': 21,
	          'discussNum': 3
	        },
	        {
	          'administrativeName': '长治市',
	          'projectNum': 21,
	          'discussNum': 57
	        },
	        {
	          'administrativeName': '吕梁市',
	          'projectNum': 11,
	          'discussNum': 19
	        },
	        {
	          'administrativeName': '山西省',
	          'projectNum': 80,
	          'discussNum': 72
	        }
	      ],
	      maxY1: 80, //Y1轴的最大值
	      maxY2: 160,// Y2轴的最大值

	      // 统一修改图表的展示与隐藏
	      legendType: '', // 图例操作类型
	      legendName: '', // 图例操作名称
	      projectShow: true,
	      discussShow: true
		}
	},
	methods: {
		initMap() {
			...
			district.search('山西省', function(status, result) {
            if (status === 'complete') {
              const districtList = result.districtList[0].districtList // 下级区域 这里指省下面的地级市
              const zoom = _this.map.getZoom() // 地图当前缩放比例
              districtList.map(value => {
                const position = _this.map.lngLatToContainer([value.center.lng, value.center.lat]).round()
                const data = _this.cityDataList.filter(item => item.administrativeName === value.name)
                _this.cityList.push({
                  position: position,
                  center: [value.center.lng, value.center.lat],
                  zoom: zoom,
                  data: data[0]
                })
              })
              ...
              // 每次缩放结束后重新计算 缩放比
              _this.map.on('zoomend', function() {
                const zoom = _this.map.getZoom()
                _this.cityList.map(value => {
                  _this.$set(value, 'zoom', zoom)
                })
              })
              // 每次移动后重新计算 像素
              _this.map.on('mapmove', function() {
                // console.log(_this.map.getCenter());
                _this.cityList.map(value => {
                  const position = _this.map.lngLatToContainer([value.center[0], value.center[1]]).round()
                  _this.$set(value, 'position', position)
                })
              })
              // 每次旋转后重新计算 像素
              _this.map.on('mousemove', function() {
                _this.cityList.map(value => {
                  const position = _this.map.lngLatToContainer([value.center[0], value.center[1]]).round()
                  _this.$set(value, 'position', position)
                })
              })
            })
		}
	}
}
</script>
<style scss="scss">
	...
	.legend-container {
        position: absolute;
        z-index: 10;
        display: flex;
        flex-direction: column;
        align-items: flex-start;
        left: 20px;
        top: 20px;
        .legend-box {
            cursor: pointer;
            display: flex;
            align-items: center;
            justify-content: center;
            .legend-icon {
                width: 15px;
                height: 15px;
                border-radius: 100%;
                background-image: linear-gradient(rgb(75, 75, 75), rgb(75, 75, 75));
                margin-right: 5px;
            }
            .legend-text {
                font-size: 15px;
                color: transparent;
                background-image: linear-gradient(rgba(190, 237, 113, 1), rgba(190, 237, 113, 0.3));
                -webkit-background-clip: text;
            }
        }
        .legend-left {
            margin-bottom: 10px;
            .legend-text {
                background-image: linear-gradient(rgba(242, 212, 111, 1), rgba(242, 212, 111, 0.3));
            }
        }
    }
</style>
<template>
  <div :id="`main${id}`" ref="chartBar" class="test-position" :style="{left: `${left - size/4}px`, top: `${top - size}px`,width: `${size * 0.5}px`, height: `${size}px`}" />
</template>
<script>
import * as echarts from 'echarts'
export default {
  props: {
    left: {
      type: Number,
      default: 10
    },
    top: {
      type: Number,
      default: 10
    },
    id: {
      type: Number,
      default: 0
    },
    zoom: {
      type: Number,
      default: 7
    },
    legendType: {
      type: String,
      default: ''
    },
    legendName: {
      type: String,
      default: ''
    },
    objData: {
      type: Object,
      default: function() {
        return {}
      }
    },
    maxY1: {
      type: Number,
      default: 0
    },
    maxY2: {
      type: Number,
      default: 0
    }
  },
  data() {
    return {
      myChart: null,
      size: 0
    }
  },
  watch: {
    zoom: {
      handler(value) {
        if (value >= 6 && value < 7) {
          this.size = value * 6
        } else if (value >= 7 && value < 8) {
          this.size = value * 10
        } else if (value >= 8 && value < 9) {
          this.size = value * 15
        } else if (value >= 9 && value <= 10) {
          this.size = value * 20
        }
      },
      immediate: true
    },
    legendType: {
      handler(value) {
        this.handleSelected(value, this.legendName)
      }
    },
    legendName: {
      handler(value) {
        this.handleSelected(this.legendType, value)
      }
    }
  },
  async mounted() {
    await this.initChart()
    const resizeObserver = new ResizeObserver(this.onResize)
    resizeObserver.observe(this.$refs.chartBar)
  },
  methods: {
    onResize(e) {
      // console.log(e);
      this.myChart.resize()
    },
    /**
     * @description: 初始化图表
     */
    initChart() {
      // 基于准备好的dom,初始化echarts实例
      this.myChart = echarts.init(document.getElementById(`main${this.id}`))
      // 绘制图表
      this.myChart.setOption({
        tooltip: {
          trigger: 'item'
        },
        legend: {
          show: false
        },
        grid: {
          width: '100%',
          height: '90%',
          top: '5%',
          left: '0%'
        },
        xAxis: {
          show: false,
          type: 'category',
          data: [this.objData.administrativeName]
        },
        yAxis: [
          {
            show: false,
            type: 'value',
            max: this.maxY1
          },
          {
            show: false,
            type: 'value',
            max: this.maxY2
          }
        ],
        series: [
          {
            name: '项目数',
            type: 'bar',
            data: [this.objData.projectNum],
            barWidth: '35%',
            yAxisIndex: 0,
            itemStyle: {
              // borderRadius: this.size * 0.1,
              color: {
                type: 'linear',
                x: 0,
                y: 0,
                x2: 0,
                y2: 1,
                colorStops: [{
                  offset: 0, color: 'rgba(242, 212, 111, 1)' // 0% 处的颜色
                }, {
                  offset: 1, color: 'rgba(242, 212, 111, 0.3)' // 100% 处的颜色
                }],
                global: false // 缺省为 false
              }
            },
            barGap: '50%'
          },
          {
            name: '评价数',
            type: 'bar',
            data: [this.objData.discussNum],
            barWidth: '35%',
            yAxisIndex: 1,
            itemStyle: {
              // borderRadius: this.size * 0.1,
              color: {
                type: 'linear',
                x: 0,
                y: 0,
                x2: 0,
                y2: 1,
                colorStops: [{
                  offset: 0, color: 'rgba(190, 237, 113, 1)' // 0% 处的颜色
                }, {
                  offset: 1, color: 'rgba(190, 237, 113, 0.3)' // 100% 处的颜色
                }],
                global: false // 缺省为 false
              }
            },
            barGap: '50%'
          }
        ]
      })
    },
    /**
     * @description: 图例触发的行为
     * @param {'legendSelect' | 'legendUnSelect'} type 行为类型
     * @param {string} name 图例名称
     */
    handleSelected(type, name) {
      this.myChart.dispatchAction({
        type: type,
        // 图例名称
        name: name
      })
    }
  }
}
</script>
<style lang="scss">
.test-position {
    position: absolute;
}
</style>
参考文献
JS API 使用
JS API 参考手册
ECHARTS 配置项手册
ECHARTS API 文档