立即学习:https://edu.csdn.net/course/play/24913/285847?utm_source=blogtoedu
type参数
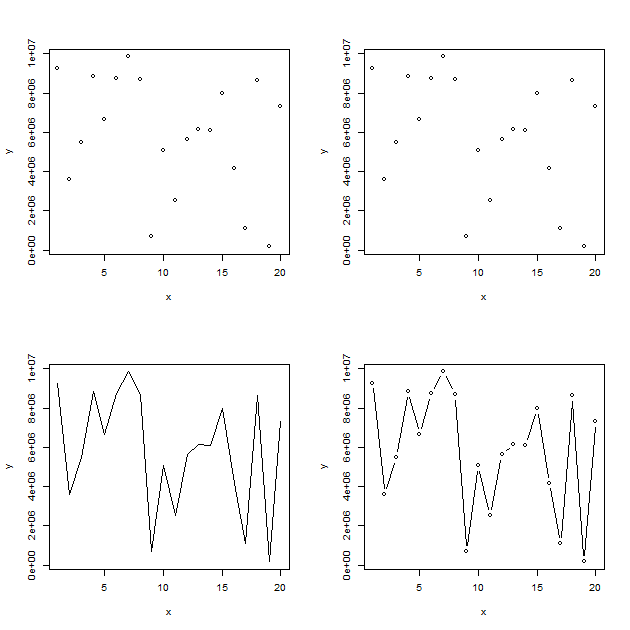
type="p " 在图形中数据显示为点
type="l " 在图形中数据显示为线
type="b" 在图形中数据显示为点和连接线
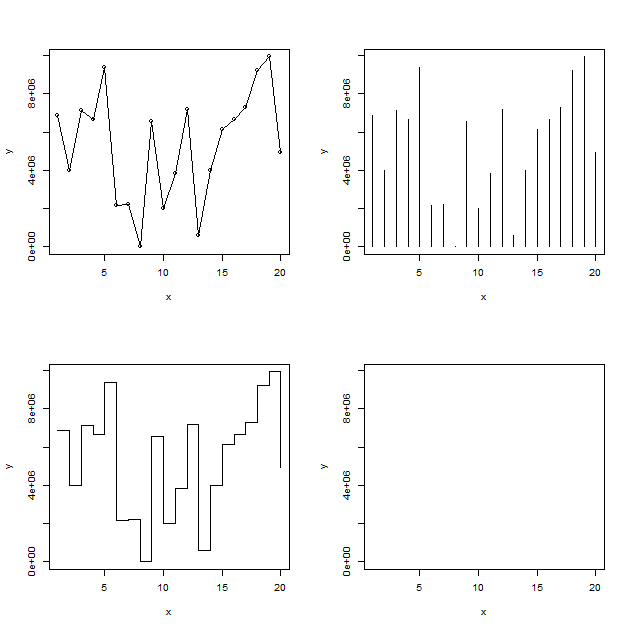
type="o" 在图形中数据点覆盖在线上
type="h" 在图形中数据显示为从点到x轴的垂直线
type="s" 在图形中数据显示为阶梯图type="n"在图形中数据不显示
x = 1:20
y = sample(1:10000000, 20)
par(mfrow = c(2, 2))
plot(x, y)
plot(x, y, type = "p")
plot(x, y, type = "l")
plot(x, y, type = "b")
对应结果:
x<-1:20
y<-sample(1:10000000,20)
par(mfrow=c(2,2))
plot(x,y,type='o')
plot(x,y,type='h')
plot(x,y,type='s')
plot(x,y,type='n')
对应结果: